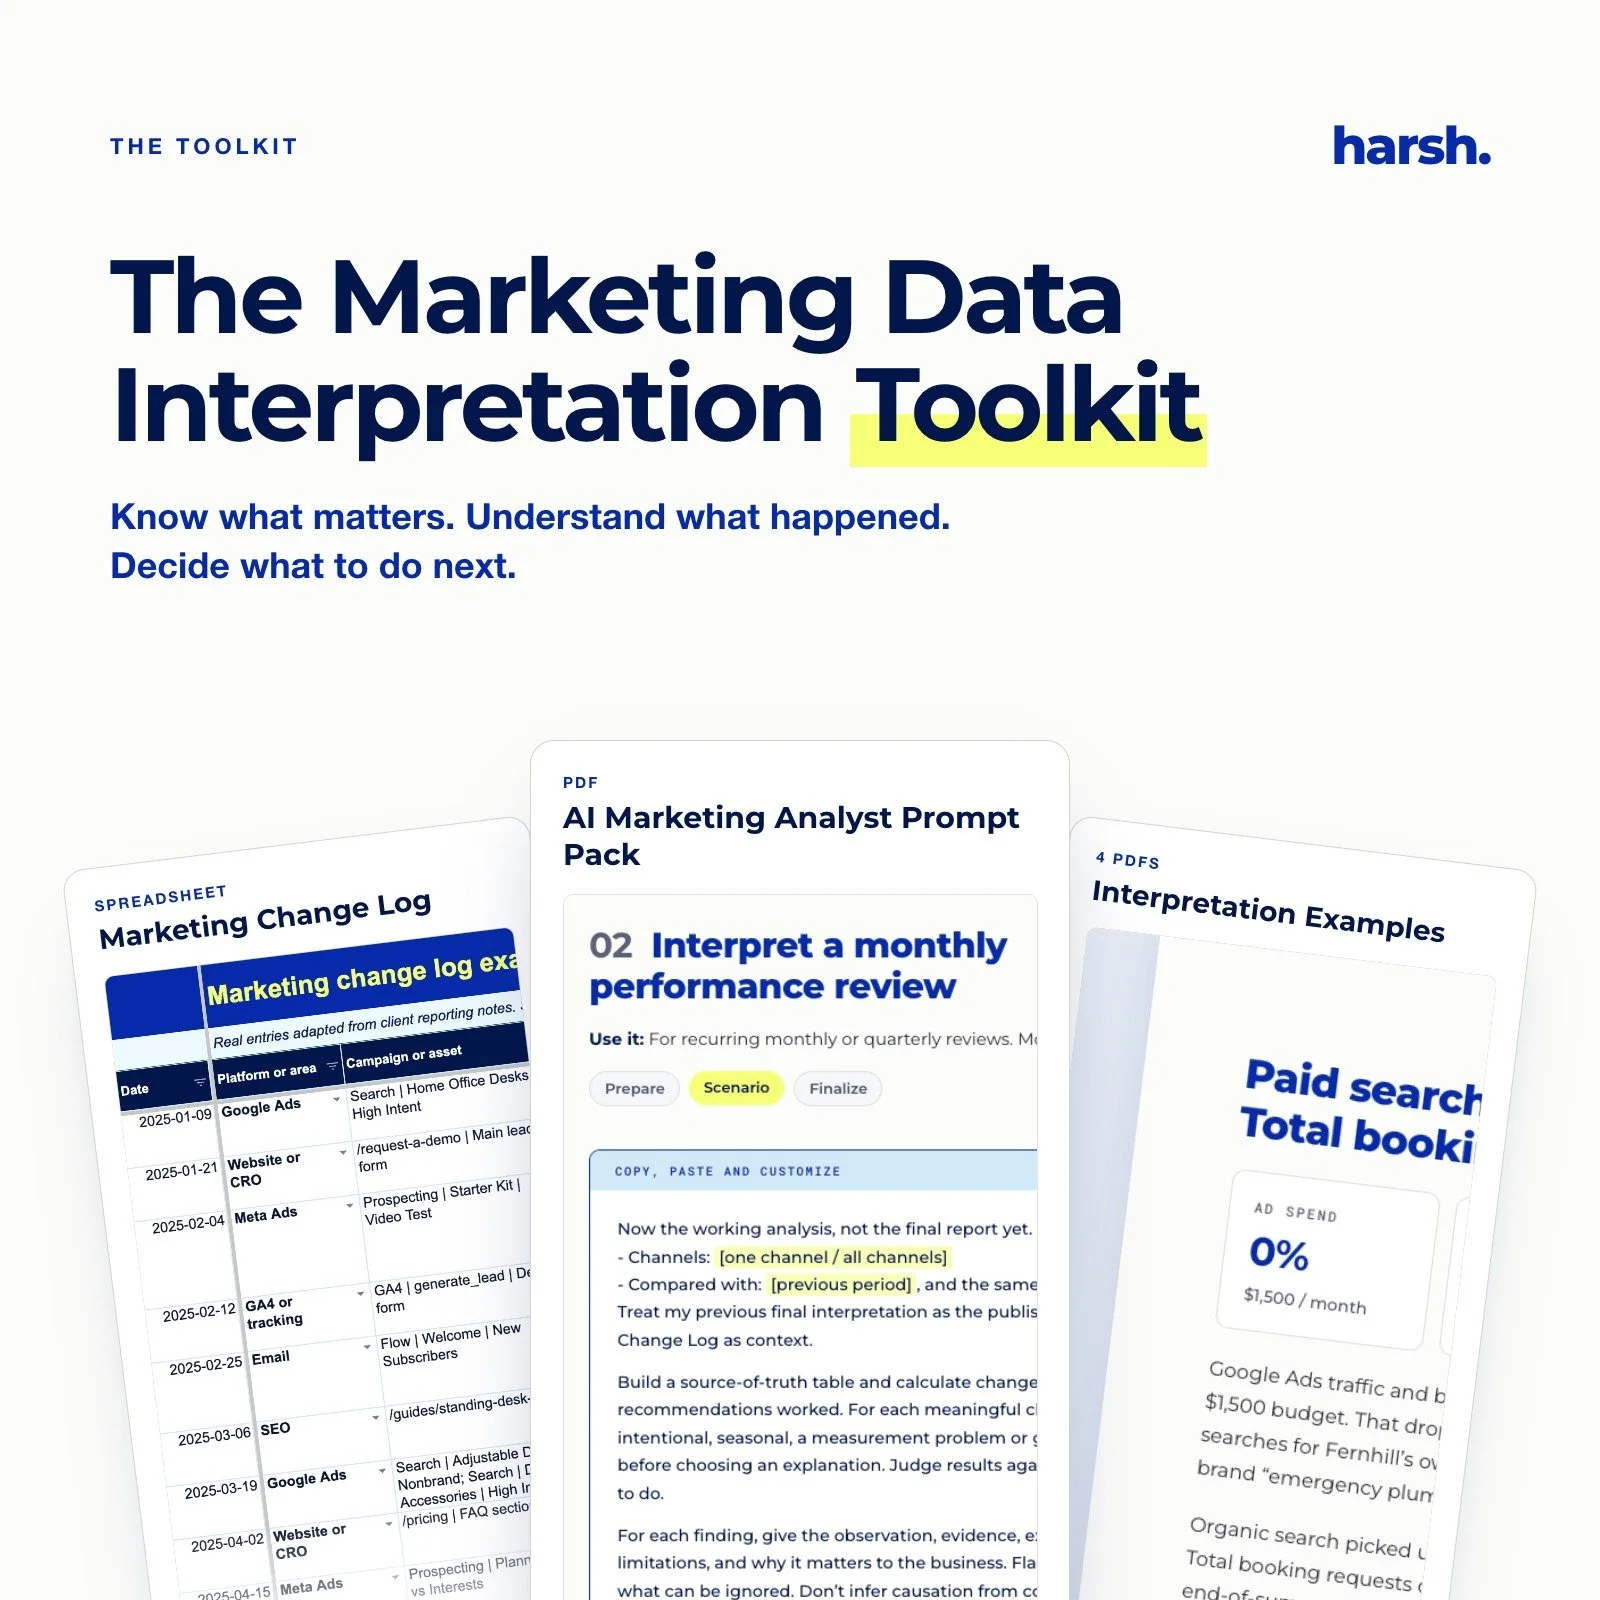
Know what your marketing numbers actually mean, and explain them with confidence to your boss, client or team.
Tired of staring at a dashboard thinking "okay, but is this good?" This toolkit gives you a repeatable way to work out what happened, why it happened, and what to do next.
Follow four simple moves (Look sideways, Look deeper, Look wider, Look back) to investigate any change in your data. Then use AI to do the heavy lifting, and turn your findings into a clear report people actually read.
What's included:
The Marketing Data Interpretation Toolkit (27-page PDF guide)
Four worked examples, each with the full investigation and the finished report: a monthly review, an annual assessment, a campaign report and a tracking issue
The AI Marketing Analyst Prompt Pack: copy-and-paste prompts for every stage, from preparing your data to writing the final report
The Marketing Change Log (spreadsheet), with a filled-in example tab, so you always know what changed and why
Works with whatever data you already have: GA4, Google Ads, Meta, Data Studio, or just screenshots. Nothing to install. Buy once and use it on every report you write.
Because anyone can show the numbers. Be the person who knows what they mean.
The final line reuses the closing line from page 3 of the guide, so the listing sounds like the toolkit.
Stop reporting the numbers. Start explaining them.
You’ve got the dashboards and the platform insights. But when someone asks “so what does this actually mean?”, you’re stuck reading the numbers back to them.
Learn to explain what happened, why, and what to do next. Calmly. With receipts.
Get the toolkit →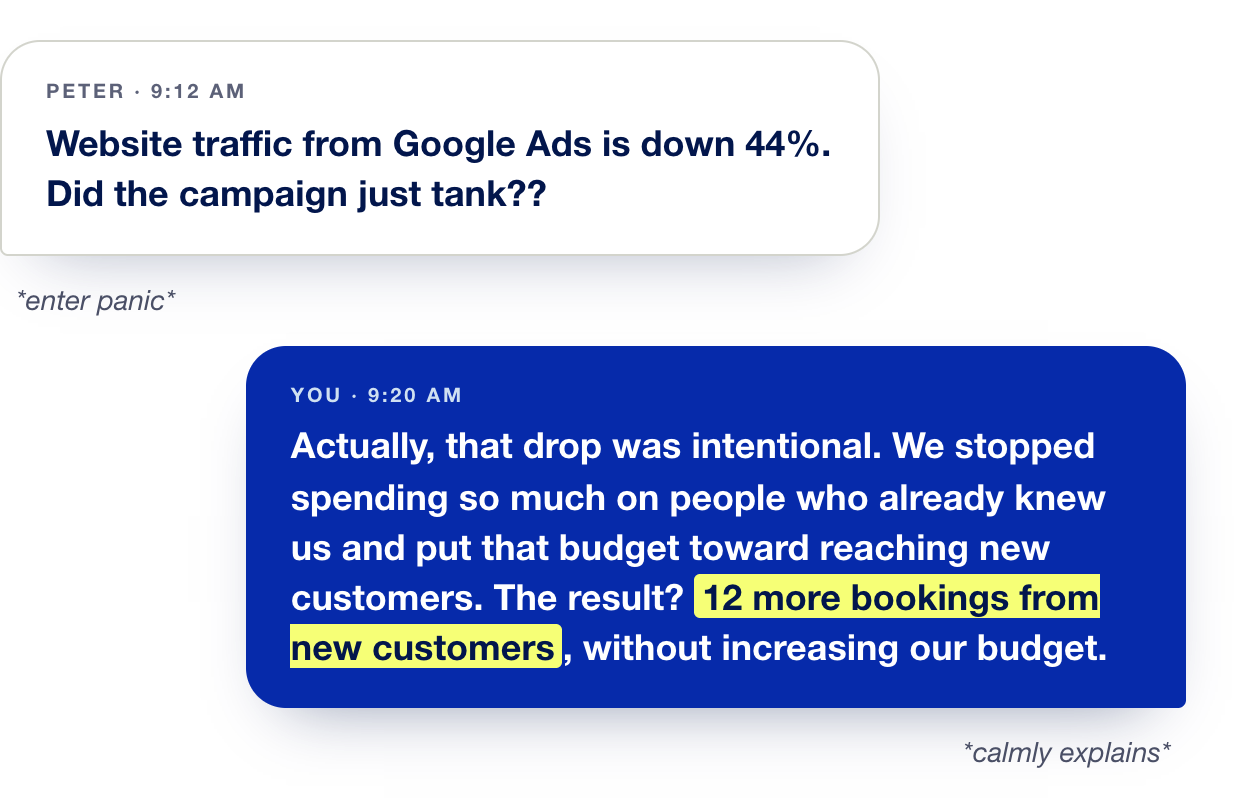
Anyone can export a report. The marketer who can explain it is the one people listen to.
And yes, AI can do the heavy lifting. Feed it your reports and the right prompts, and get a client-ready write-up in minutes. You just make the calls.
Peter has opinions. You have the data.
Most marketers don’t have a shortage of numbers. What they’re missing is a clear way to explain them before someone else’s hot take becomes the strategy.

This is what interpretation actually looks like: two people, one report, and a lot of “wait, why did that change?”
No fancy software. Just the right questions, asked in the right order, until the numbers make sense. That’s the process this toolkit teaches.
Let’s fix this.
The goal isn’t to silence Peter. It’s to have a better conversation with him. This toolkit is the process we use with our own clients: learn the moves, see them in four real reports, then run your own.
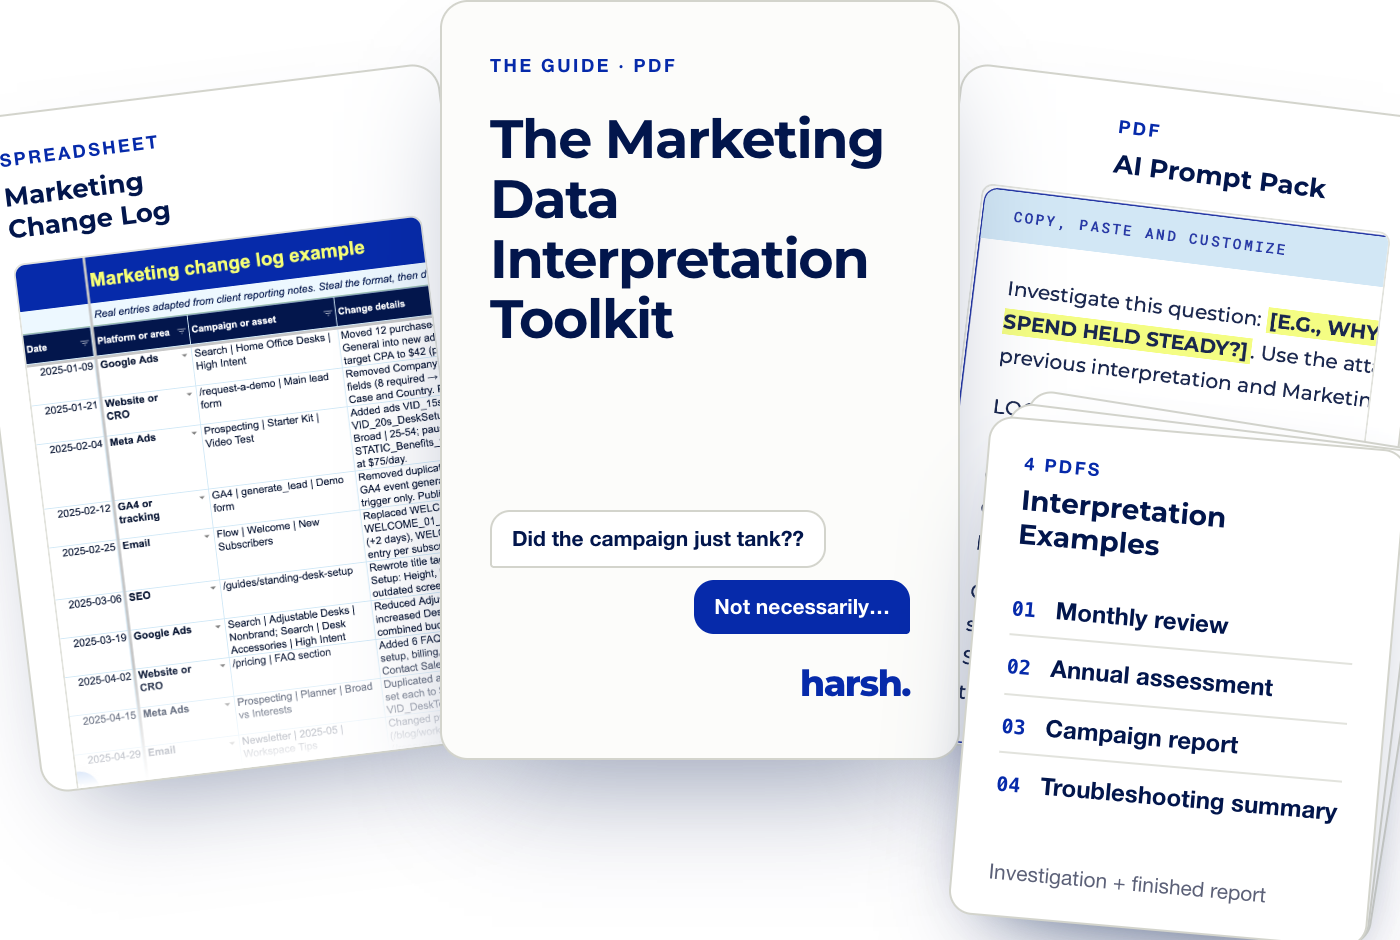
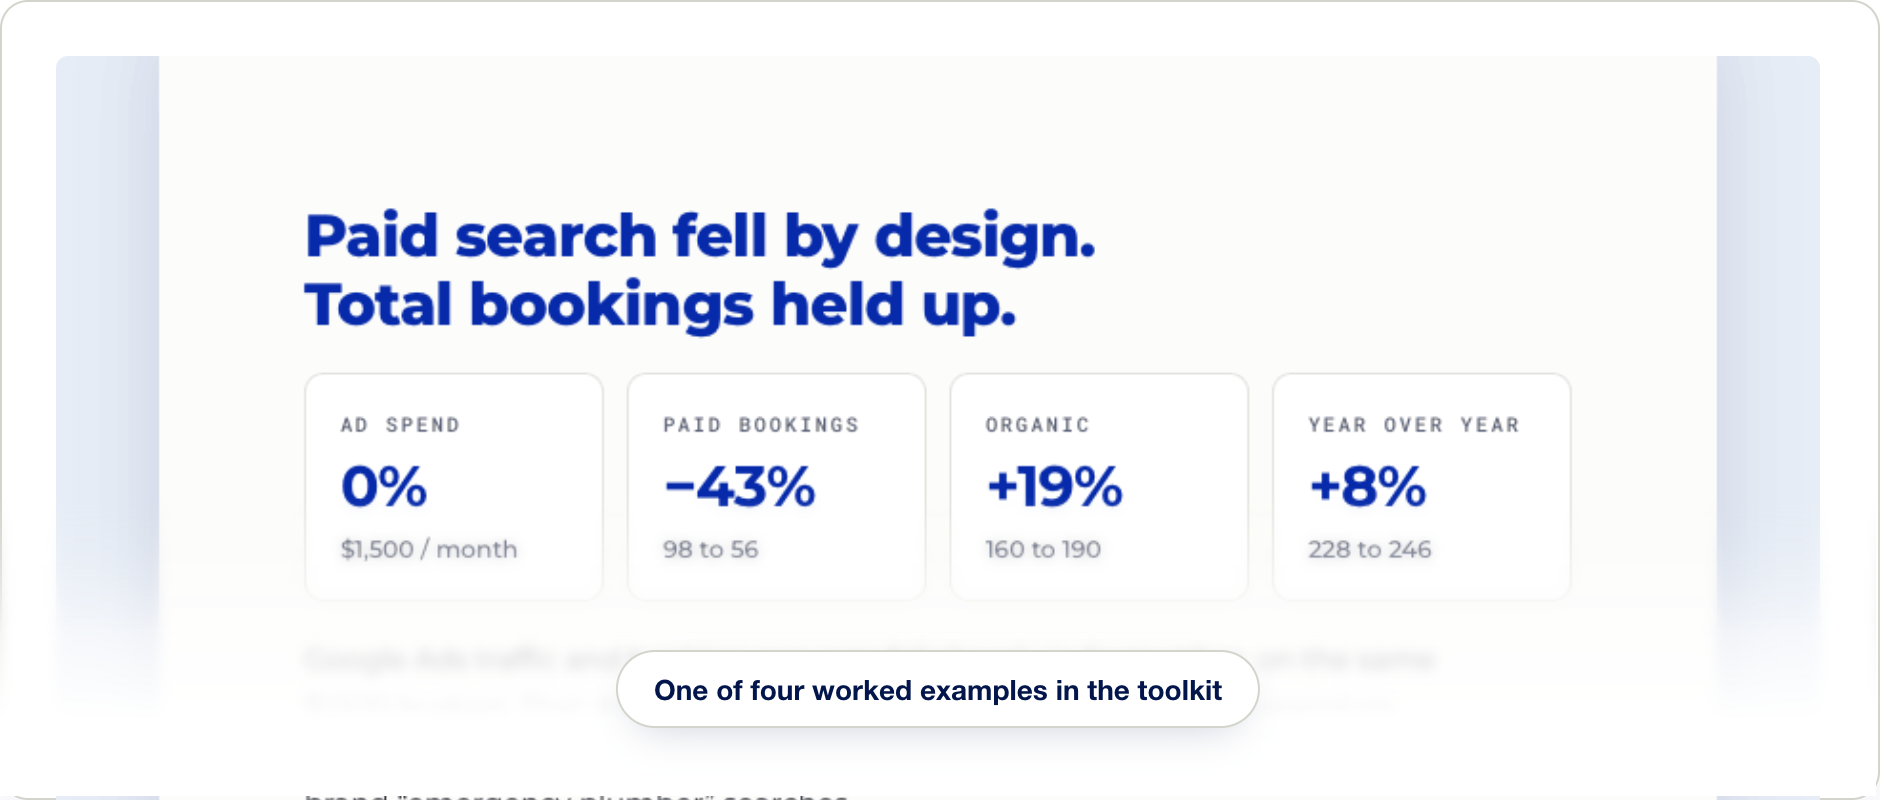
A few samples from inside the toolkit.
Real pages from the guide and its companion resources.
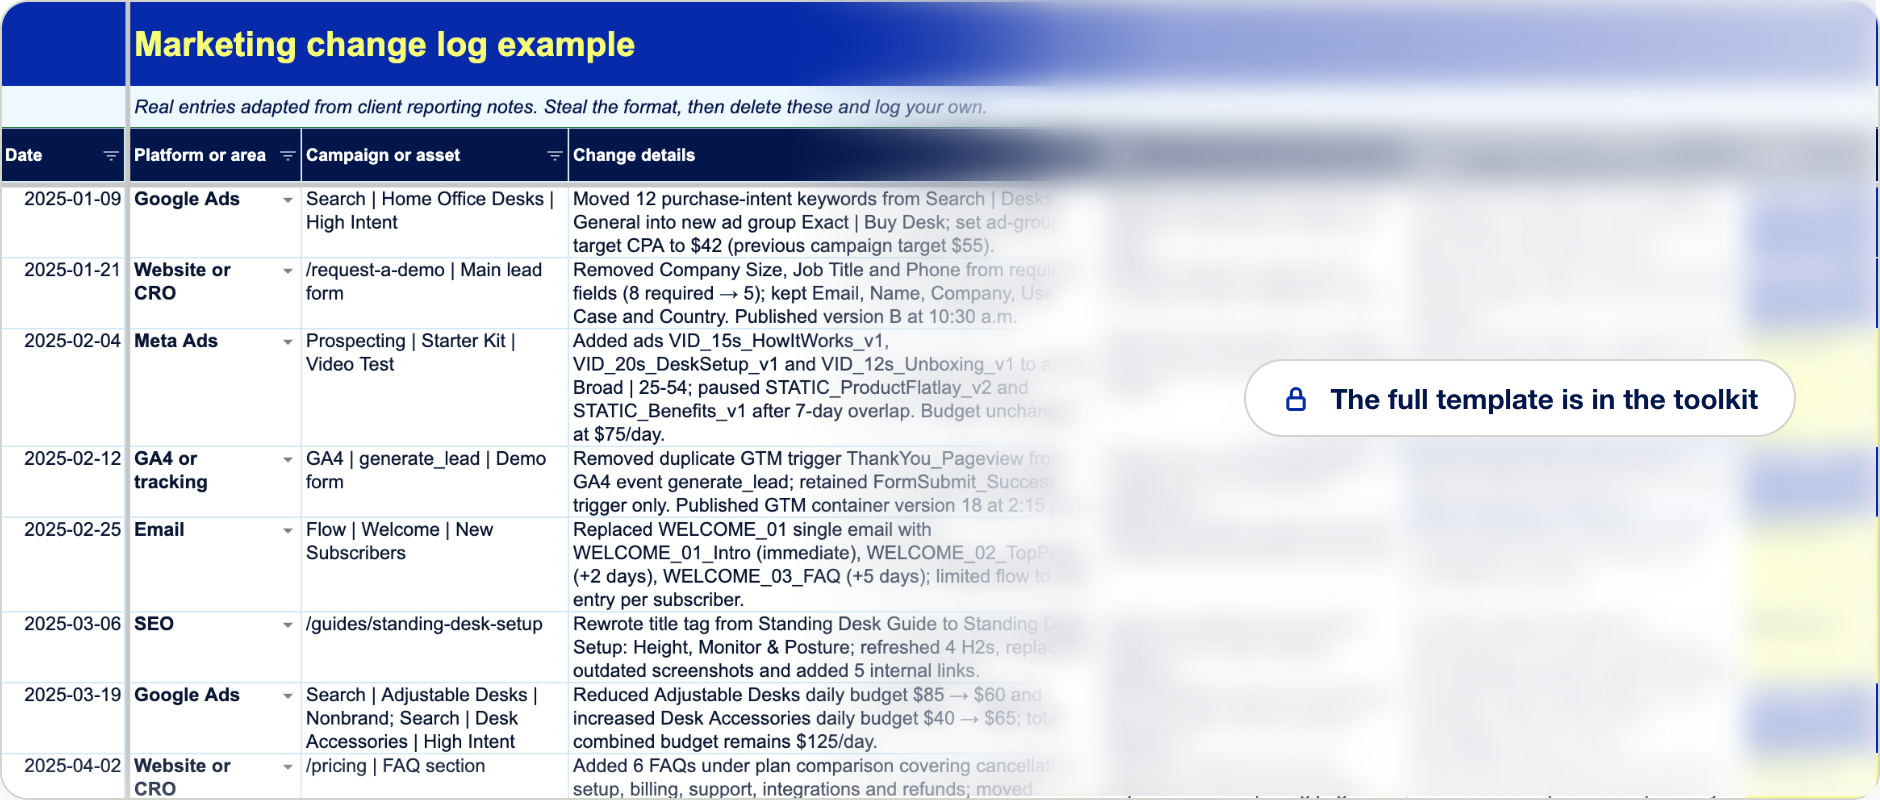

We built this because we answer the same question you do: “So, what do these numbers actually mean?”
We’re Maddie and Sara, the duo behind Harsh Marketing. We spent 10 years working side by side at a marketing agency, writing the monthly reviews, year-end plans, campaign wrap-ups and “wait, why did this suddenly drop?” emails. Turning clients’ numbers into decisions is what we do.
Over time, that process became a checklist, then a framework, then this toolkit. It’s exactly how we work, written down so you can do it too.
Consider us your analytics besties.
Everything you need to explain your numbers.
Confident interpretation, without hiring an analyst.
Next time Peter says “I think”, you’ll say “here’s what happened.”
Know what matters. Understand what happened. Decide what to do next.
Yes, I need this! →