
Turn your analytics into a business case (that actually gets a “yes”)
You’ve got the numbers. The reports are reporting. But somehow, when it’s time to present your findings to decision-makers... crickets.
Here’s the truth: data alone isn’t enough to make things happen.
To get buy-in, your analytics need to tell a STORY – and more importantly, make a case.
Whether you’re pitching a new campaign, justifying a platform change, or trying to unlock more budget, here’s how to build a business case that gets attention (and approval).
1. Start with the “why”
Every strong business case starts with a clear problem. A specific challenge your team is facing right now.
For example: “Website visitors aren’t converting into app downloads.” Or simply, “We just launched an app and want downloads, period.”
That one sentence sets the stage. It gives your audience a reason to care and opens the door for your data to step in as the hero.
2. Show the story in the numbers
This is where most marketers go wrong. They list every stat in the report and hope someone else connects the dots.
Spoiler: they won’t.
Instead, pull out the insights that explain why downloads are lagging. For example:
“70% of mobile users drop off before reaching the download CTA.”
“Only 8% of traffic to the app landing page is coming from organic search.”
“Sessions from paid ads have a 40% lower bounce rate – but users don’t scroll past the hero section.”
These kinds of insights move the story forward. They frame the problem and start hinting at the solution.
3. Tie metrics to action
Now that you’ve shown the ‘why,’ connect it to what’s next.
Example actions tied to the app download problem:
“Moving the CTA higher on the page could reduce drop-offs by X%.”
“Optimising for mobile could increase engagement across paid traffic sources.”
“Expanding local keyword coverage could drive more qualified organic traffic to the app page.”
You’re not just saying, “Here’s what’s broken.”
You’re saying, “Here’s what we can fix – and here’s how the data supports it.”
4. Make it visual
You don’t need a polished slide deck – but you do need visuals.
Dashboards like Looker Studio (our go-to!) let you show the full story without overwhelming your audience. The goal: make the insights easy to grasp at a glance.
Pro tip: use visuals that support your case.
For example:
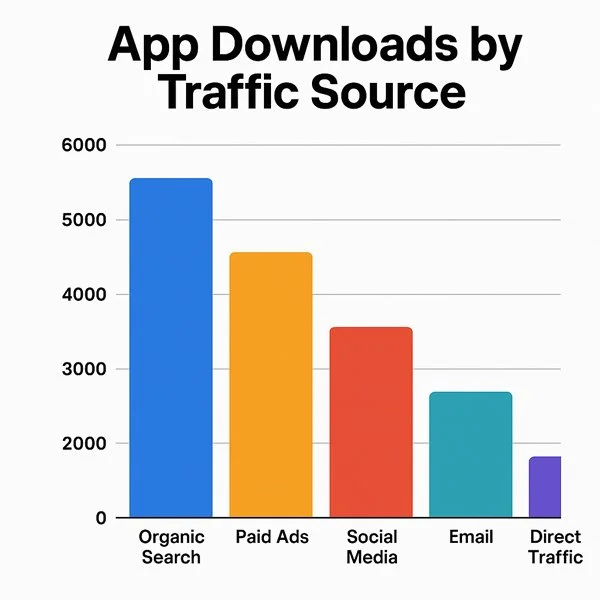
A bar chart showing app downloads by traffic source
A line graph comparing scroll depth before and after a landing page change
These visuals make your points unmissable – especially when decision-makers are short on time.
5. End with impact
Don’t just stop at recommendations – show the upside.
Wrap with a forward-looking statement like:
“By updating the landing page and adjusting our traffic strategy, we project a 25% increase in app downloads over the next 30 days.”
It’s not just about identifying the problem – it’s about showing what success looks like and how to get there.
The best analytics presentations don’t just show numbers – they build a bridge between the problem and the solution.
In this case? You’re not just reporting on app downloads.
You’re making a business case for how to increase them – and giving leadership a clear path forward.