
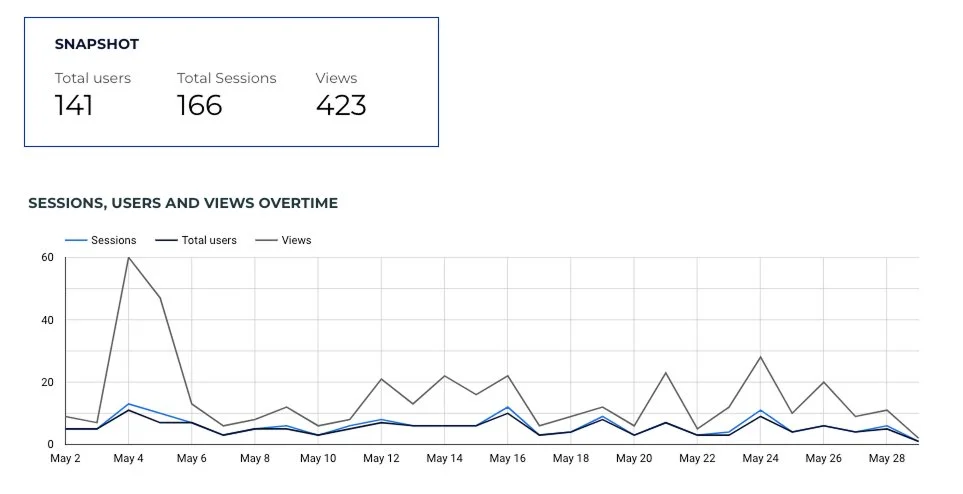
Users vs. sessions vs. page views: what’s the difference?
If you've ever opened your website analytics dashboard and thought:
"Okay but… what do these numbers even mean?"
You're not alone.
Users, sessions, and pageviews are some of the most common metrics in web analytics – but they’re also some of the most misunderstood.
If you don’t know the difference, you’re not getting the full picture. And if you’re making decisions based on the wrong interpretation? You might be prioritising the wrong strategy.
So let’s break it down.
👤 1. What are users?
Users = the unique people visiting your website.
Let’s say someone visits your site 5 times in a week. They still count as 1 user in most reporting tools (like GA4), because they’re identified by the same browser and device.
Think of users as headcount. It answers the question:
How many individual humans are landing on your site?
💡 Why it matters: User count tells you how many new or returning people you’re attracting overall. But it doesn’t tell you what they do once they land.
⏱️ 2. What are sessions?
Sessions = the total visits to your website.
Every time someone lands on your site and interacts within a specific window (usually 30 minutes), that’s a session. If they return later that day? That’s a second session.
One user can have multiple sessions.
Let’s say:
Jess visits your homepage at 10am and bounces.
She comes back at 4pm and reads a blog post.
That’s 1 user, 2 sessions.
💡 Why it matters: Sessions show how often people are engaging with your site. A high number of sessions per user can indicate strong interest or return visits. Low sessions might mean people don’t come back – or don’t find a reason to.
📄 3. What are pageviews?
Pageviews = the total number of pages viewed across all sessions.
If Jess browses 5 different pages in one session, that counts as 5 pageviews.
Pageviews show the depth of engagement. Are visitors checking out your services? Reading your blog? Or just bouncing after the homepage?
💡 Why it matters: Low pageviews might suggest your content isn’t compelling, your internal links aren’t encouraging people to explore – or your navigation is complicated.
🧠 Interpreting these metrics together
Here’s where the magic happens: individually, these metrics tell you something – but together, they tell a story.
That said, context is everything. Some sites are built to convert quickly, not to encourage tons of pageviews or return visits. So before you label something an issue, ask: what’s the goal of this site?
Some examples:
🔍 High users, low sessions
You’re attracting a lot of new people, but they’re not coming back. This could point to a retention issue – maybe your value isn’t clear, or there’s no strong reason to return.
➡️ But if your site is built for fast conversions (like a lead gen form), this may not be a problem.
👀 High sessions, low pageviews
Visitors are coming back, but not exploring many pages. That might signal weak content or confusing navigation.
➡️ Unless you only have one core offer or page – then it could just mean people are coming back to take action.
📈 High users + high sessions + high pageviews
Nice. You’ve got traffic, returning visitors, and deep engagement.
➡️ Keep an eye on conversions to make sure all that activity leads to results – but overall, this is a strong pattern.
📊 Want these metrics to work for you?
Understanding metrics is step one. But to actually use them to make better marketing decisions, you need to track the right data – and make it visual.
That’s where our Analytics Starter Kit comes in.
It’s a free guide that walks you through the tools you need to start collecting accurate data in under 10 minutes – so you’re not left guessing.
Ready to actually use your website data instead of just looking at it?