
How to track website scroll depth with GTM, GA4, and Looker Studio
Want to know how far down your audience actually scrolls on your site? Not just if they clicked into the page, but whether they made it halfway, 75%, or (gasp) even to the end?
Scroll depth tracking is your new BFF – and it’s easier to set up than you think.
Let’s walk you through setting it up in Google Tag Manager (GTM), sending the data to Google Analytics 4 (GA4), and reporting on it in Looker Studio. 💙
📊 Here’s what your end result could look like – clean, interactive tables showing exactly how deep users scroll on each page:
What you’ll need before we start
Before diving in, make sure you have:
A GA4 account set up
A GTM container installed on your website
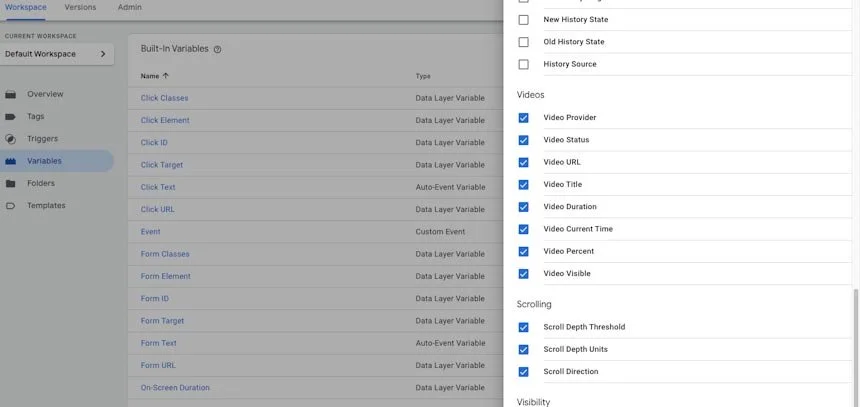
Step 1: enable scroll variables in GTM
First, head to your GTM account and go to Variables. Scroll all the way down to the Built-In Variables section and click Configure. Turn on all the scroll-related variables (yes, all of them!).
👉 Side note: why Google doesn’t just have these turned on by default is beyond us. Truly a mystery.
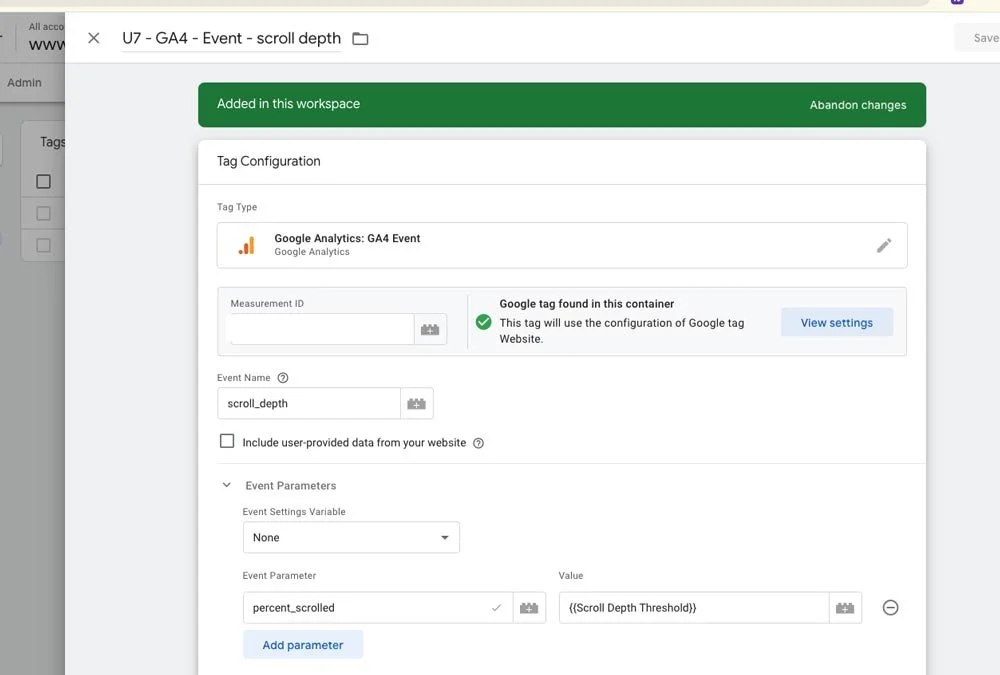
Step 2: Create a Scroll Depth Tag in GTM
Now go to Tags and click New. You’ll want to:
Choose Tag Type: GA4 Event
Input your Measurement ID - article on where to find your GA4 ID
Name your event: scroll_depth ← this is important!
Why not just use the existing scroll event? Because that one (from Enhanced Measurement) doesn’t include the actual percentage scrolled. Ours will.
➡️ To track the percentage, click the section to add Event Parameters:
Parameter Name: percent_scrolled
Value: {{Scroll Depth Threshold}} (you should now see this as an option if you turned on those variables earlier)
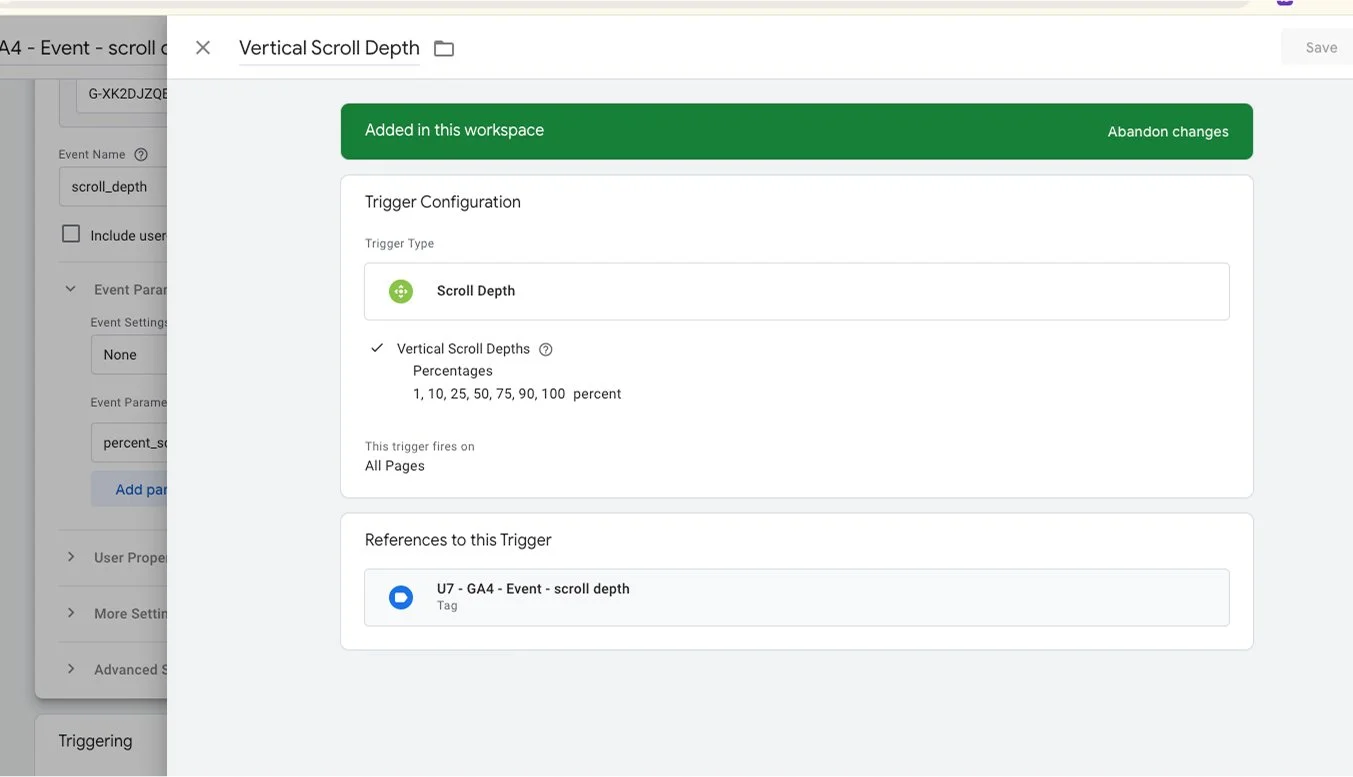
Step 3: create a trigger for scroll depth
Now let’s tell GTM when to fire that tag. You’ll want to:
Create a new Trigger
Choose Trigger Type: Scroll Depth
Set it to Vertical Scroll Depth
Select thresholds like: 1,10,25,50,75,90,100
🎯 We recommend including “1” and “100” — 1% gives you a helpful "started scrolling" marker, and 100% tells you who made it to the end. Great for filtering and reporting later.
Step 4: test & publish
Before hitting publish, make sure your tag and trigger are firing correctly.
Here’s how:
In GTM, click Preview in the top right corner.
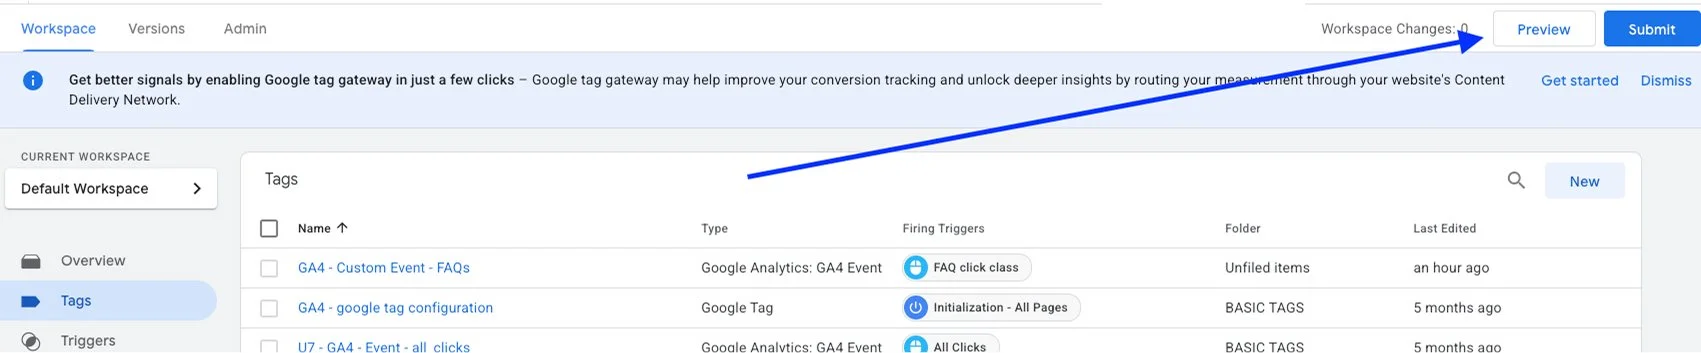
2. Enter your site URL and click Connect—this opens your site in debug mode. It will open up another window with your site’s front-end view as well. Keep both open.
3. Scroll down on a page.
4. In the debug panel, look under Tags Fired “summary panel” and confirm your GA4 event is showing up for the scroll.
For example, this event fired:
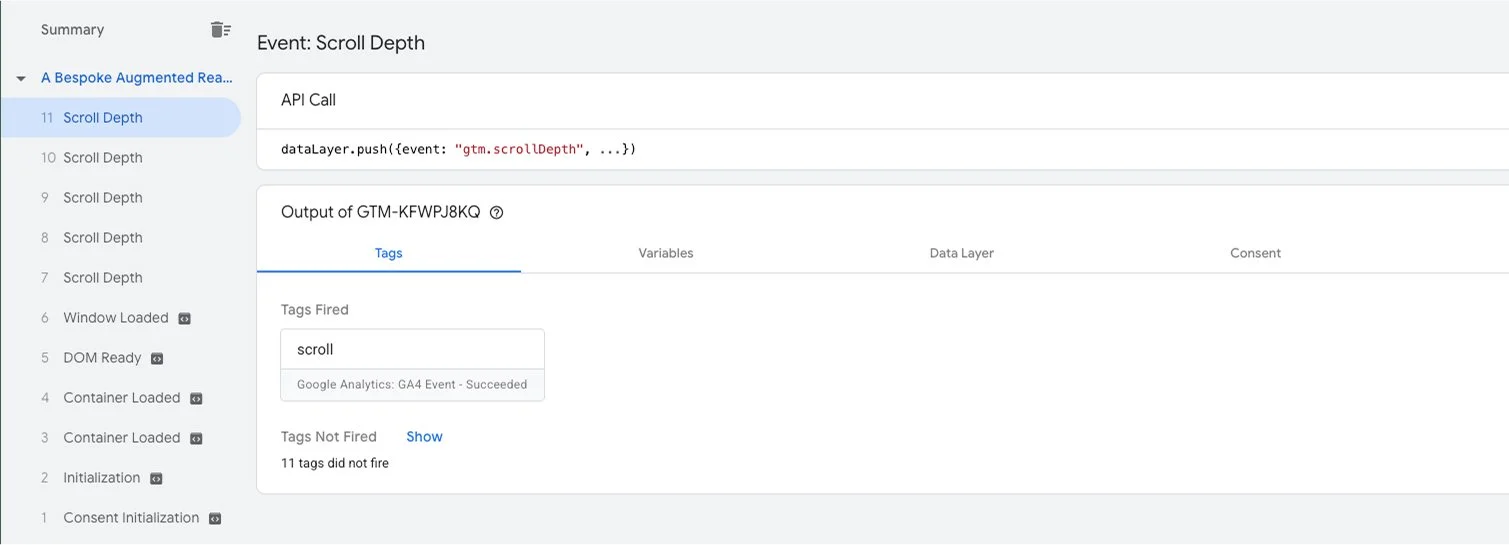
Once it’s working:
✅ Hit Submit in GTM to publish your changes.
You’re now collecting video view data in GA4.
Step 5: add a custom dimension in GA4
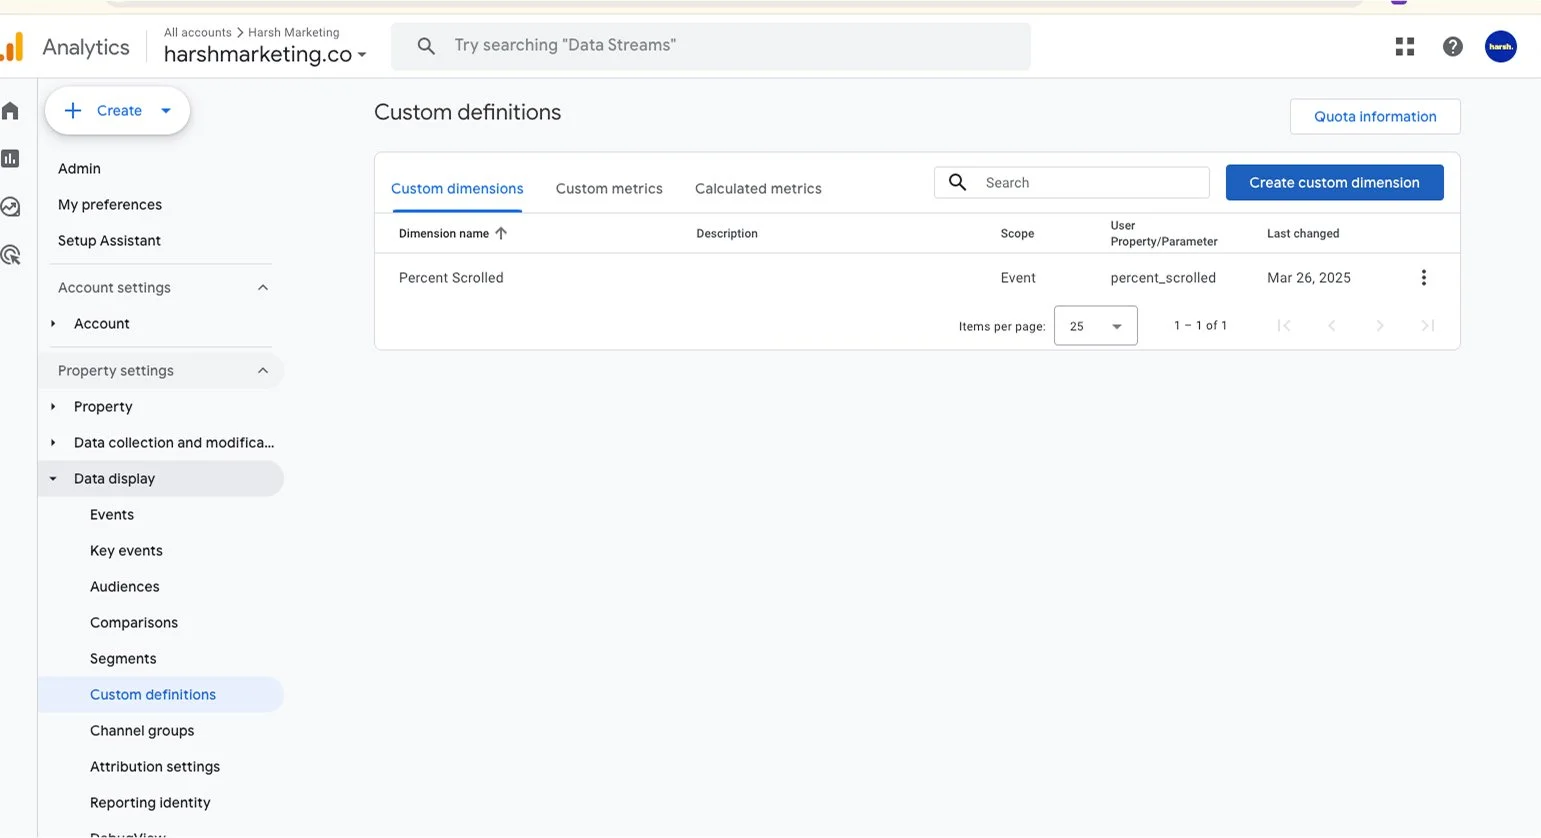
Head over to your GA4 property:
Go to Admin > Custom Definitions
Click Create Custom Dimension
Name it: Percent Scrolled
Set the parameter name to: percent_scrolled
Yes, we know—custom definitions vs custom dimensions? Welcome to the GA4 naming circus. You're technically creating a dimension here, but it lives under a section called definitions. It’s not you. It’s Google.
This step ensures the scroll data we’re sending from GTM actually shows up in GA4 and Looker Studio.
👉 If your tag’s already been firing without these set up, GA4 won’t backfill that data into your reports. Even if the parameter was collected, it won’t show up until you register it as a custom dimension. So yeah... don’t skip this step.
Step 6: report on scroll depth in Looker Studio
It’s one thing to know your scroll data exists. It’s another to see that 75% of users drop off before reaching your CTA.
Visual reporting gives you clarity at a glance—so you can confidently answer questions like:
Where are users losing interest?
Which pages are actually holding attention?
Does that long-winded intro need a haircut?
Start with the basics
Start with a table that shows how deep users are scrolling site-wide. Here’s how to set it up:
Open Looker Studio and add your GA4 property as a data source then create a report.
Insert a table with these elements:
Dimensions:Percent Scrolled
Metrics:Sessions or Users (pick one—either works)
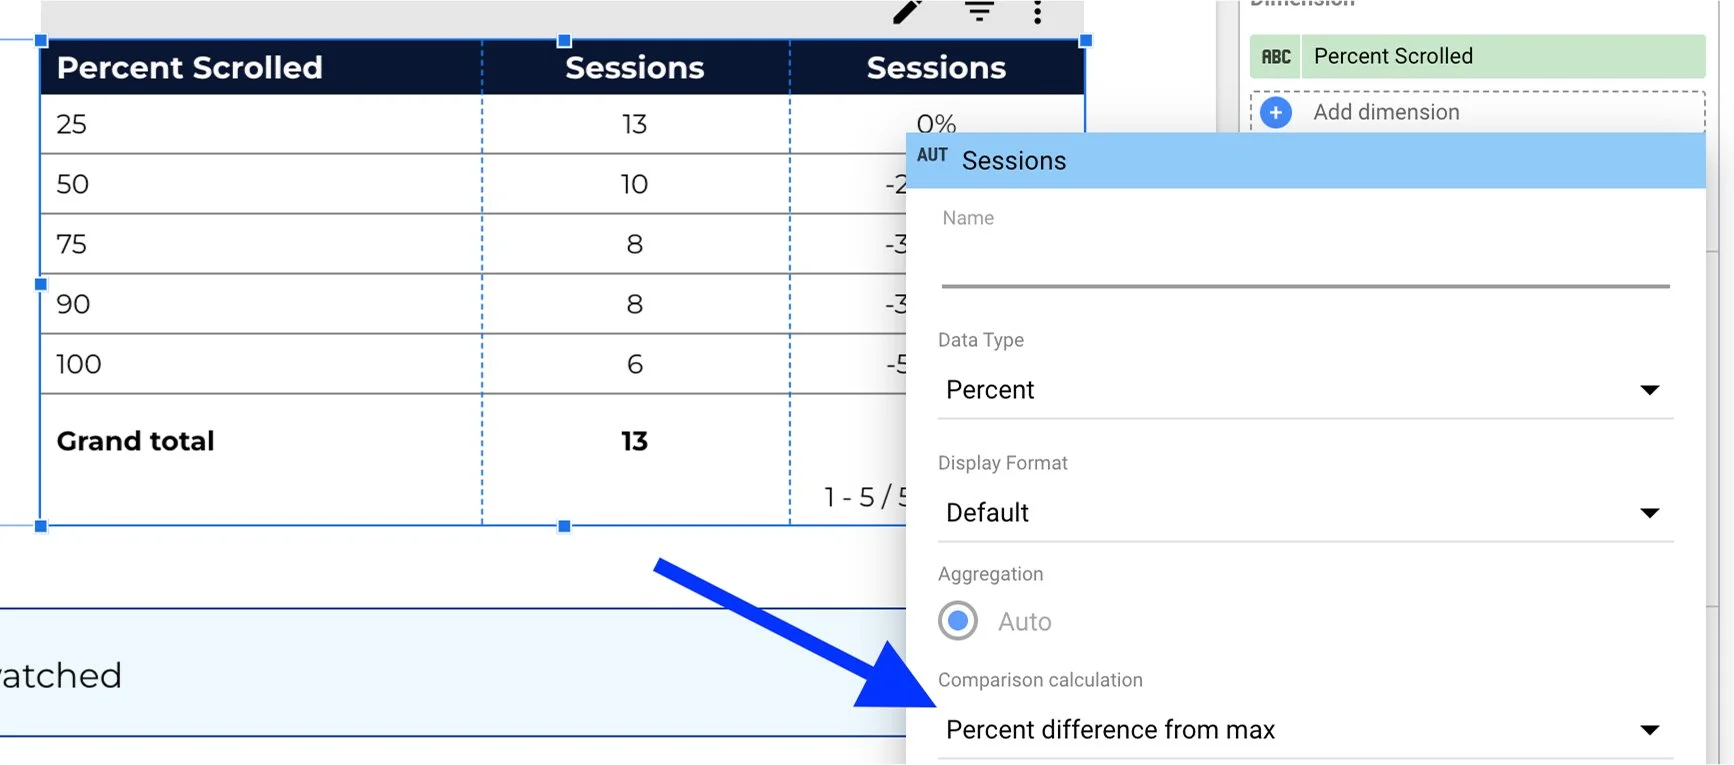
Screenshot of the dimension/metrics:
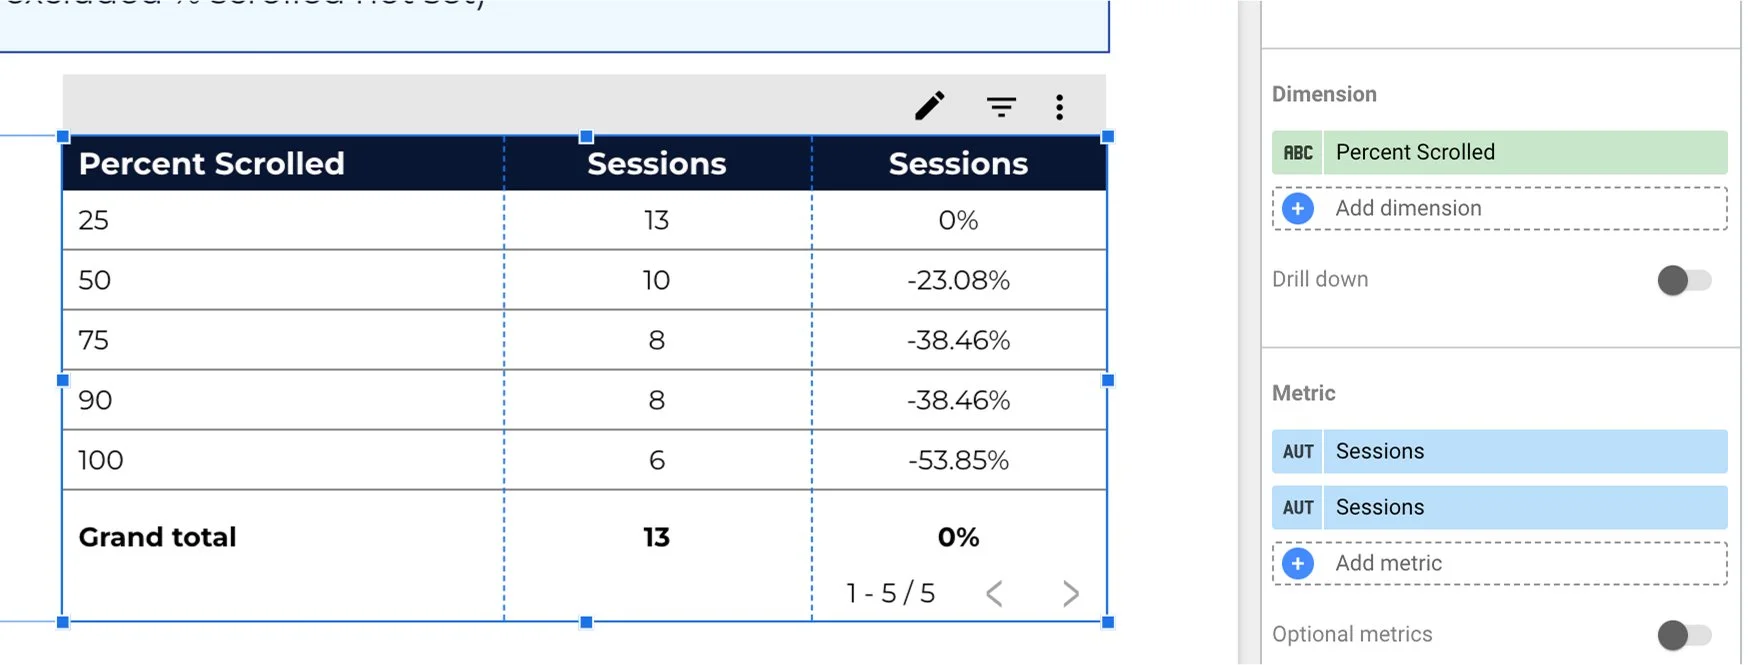
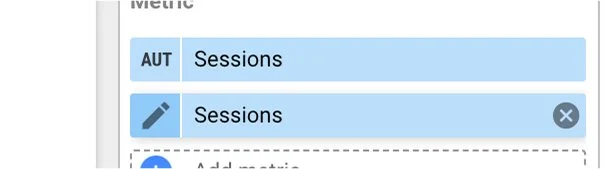
I recommend adding a second sessions or users metric, to further contextualize the data with a percentage. Click the pencil to the left of the sessions, and it’ll open up a window where you can select various comparison calculations in a drop down, choose “percent difference from max”.
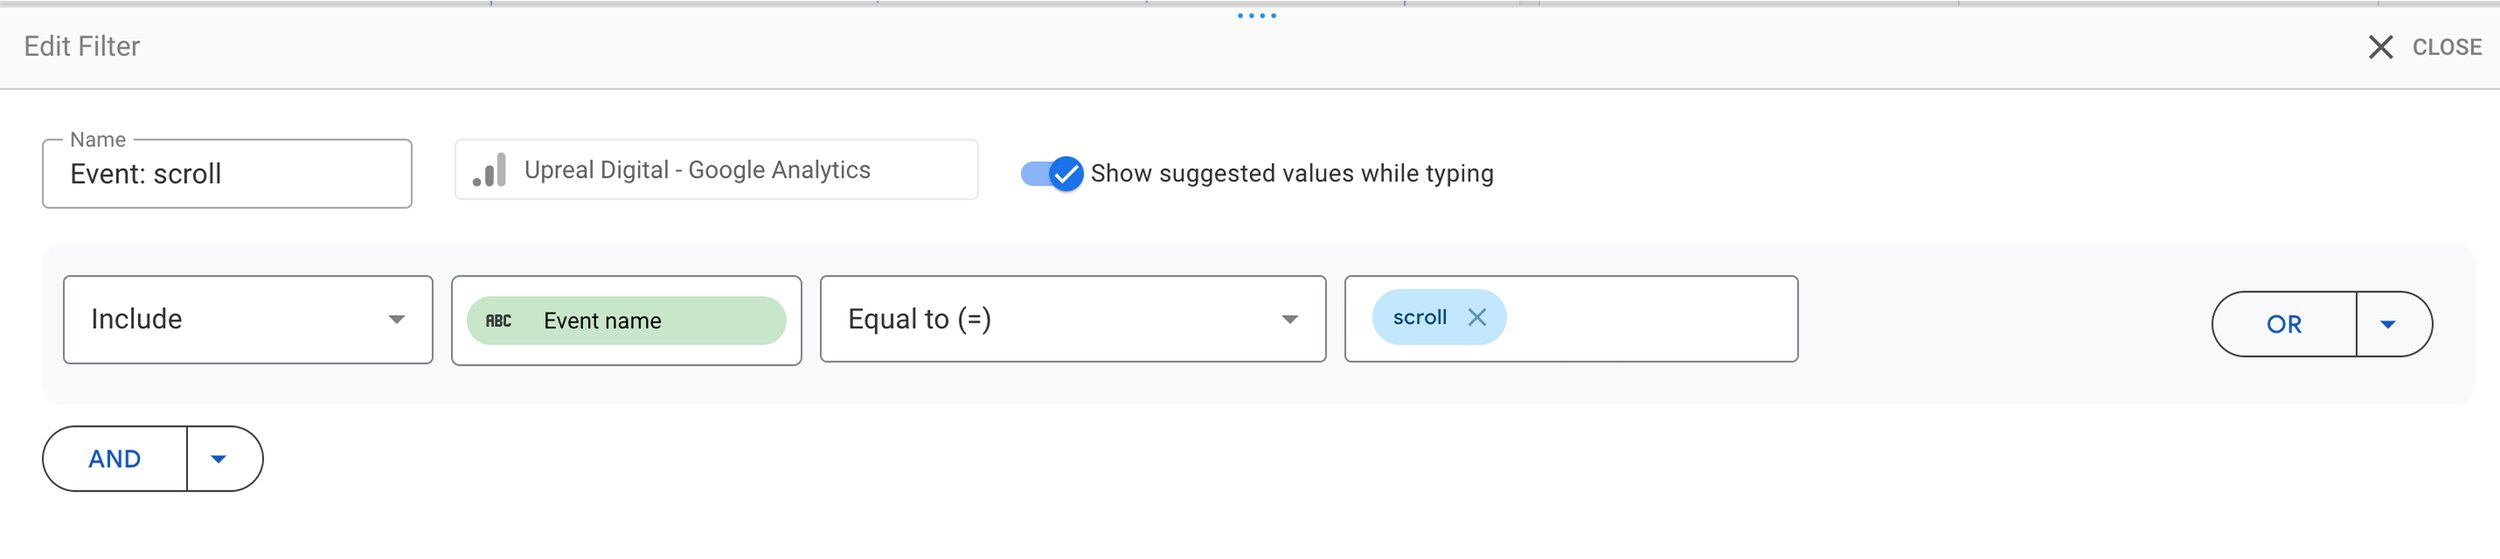
Add a table filter: Event name = scroll_depth(This ensures you're only seeing scroll data and excluding unrelated events.)
This gives you a snapshot of scroll engagement across your entire site.
But hold up—site-wide data is just a starting point. Most pages behave very differently.
Add a second table for page filtering
What if you want to know which specific pages are losing people early—and which ones are keeping them around?
That’s where this second table comes in. It acts like a filter: click on any page in the left table, and the scroll data on the right will instantly update to show you how users are engaging with that page.
Add another table to the left with the following setup:
🧩 Dimension: Page path (or Landing page)
📊 Metric: Sessions or Users
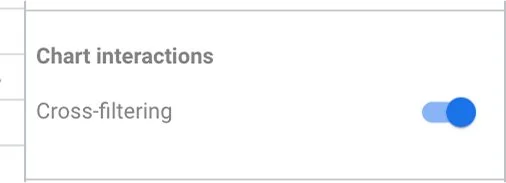
Then turn on cross-filtering so when someone clicks a page (e.g., /contact/), the scroll depth table updates to show data for that page only. This option is visible in the edit bar when you scroll all the way down. Both tables need to have this turned on:
Step 7: interpret your scroll data (what it actually tells you)
Now that your dashboard is up and running, let’s talk about what to do with the data. Here's how to interpret it using two real examples from our report:
Example 1: homepage scroll behaviour
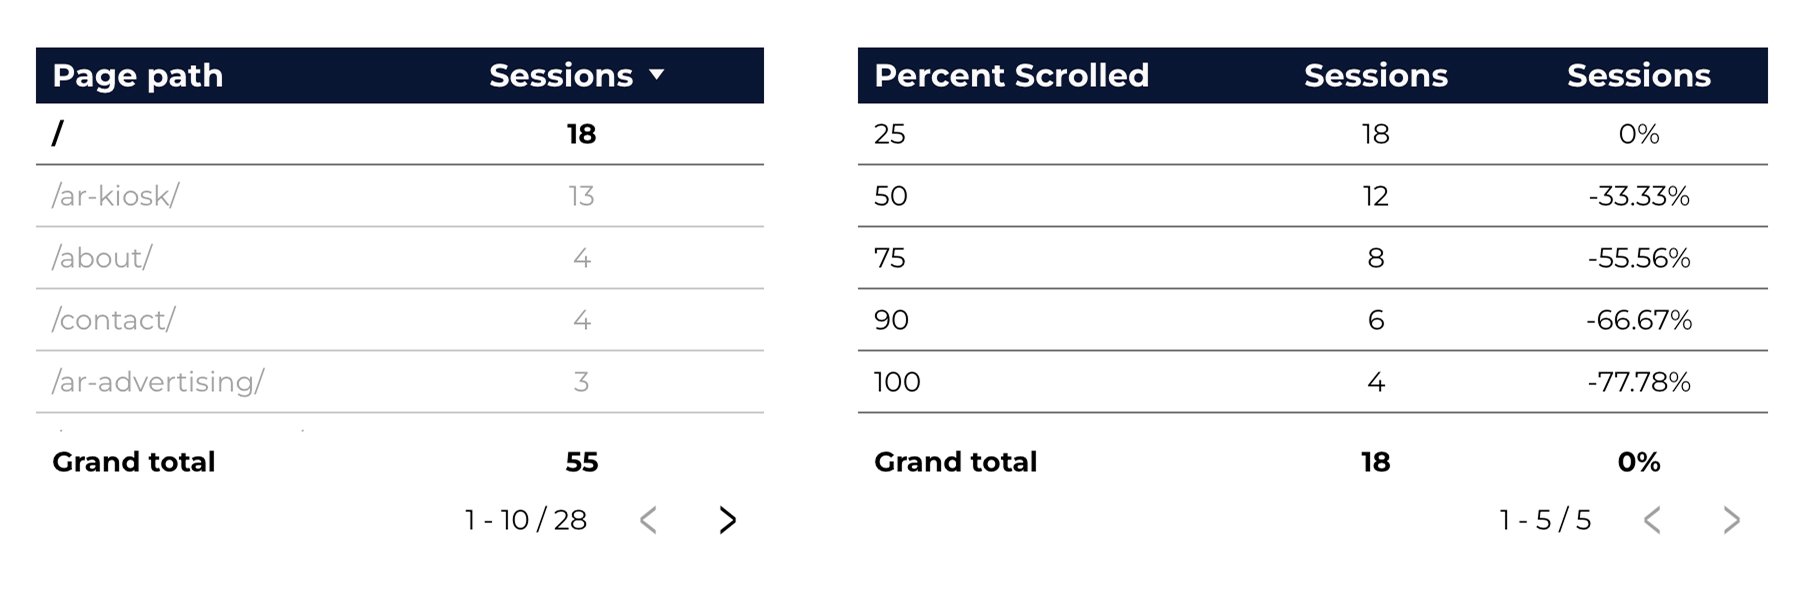
👀 From the homepage, we can see that:
100% of visitors scrolled at least 25%
But only 12 of those 18 users (≈67%) made it to 50%
And just 4 stuck around to scroll all the way to the bottom
📉 That’s a 77% drop-off from top to bottom.
💡 What it tells you: Either the content below the fold isn’t engaging enough, or users are finding what they need early on. Consider:
Moving key CTAs or messaging higher up
Testing shorter sections or stronger visual cues to pull attention downward
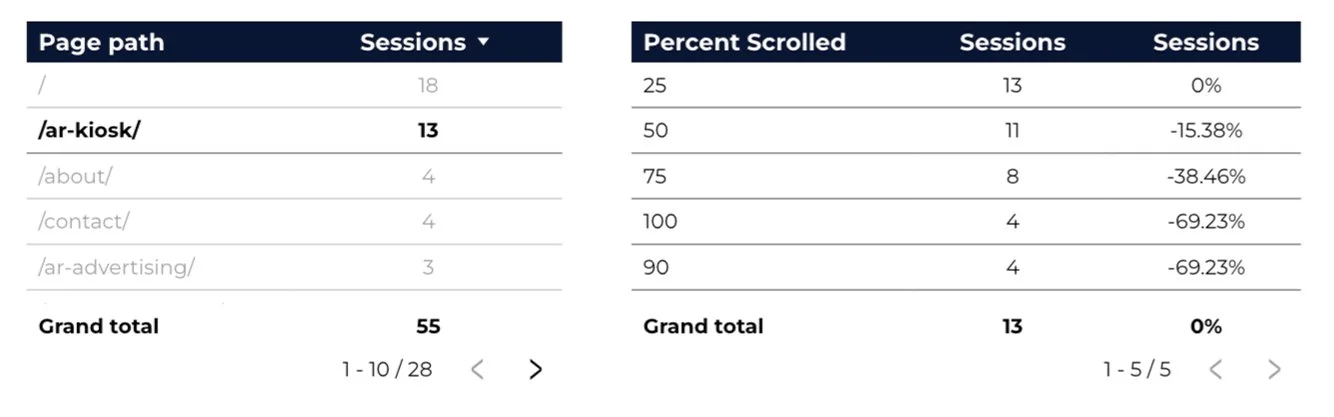
Example 2: AR Kiosk Page Performance
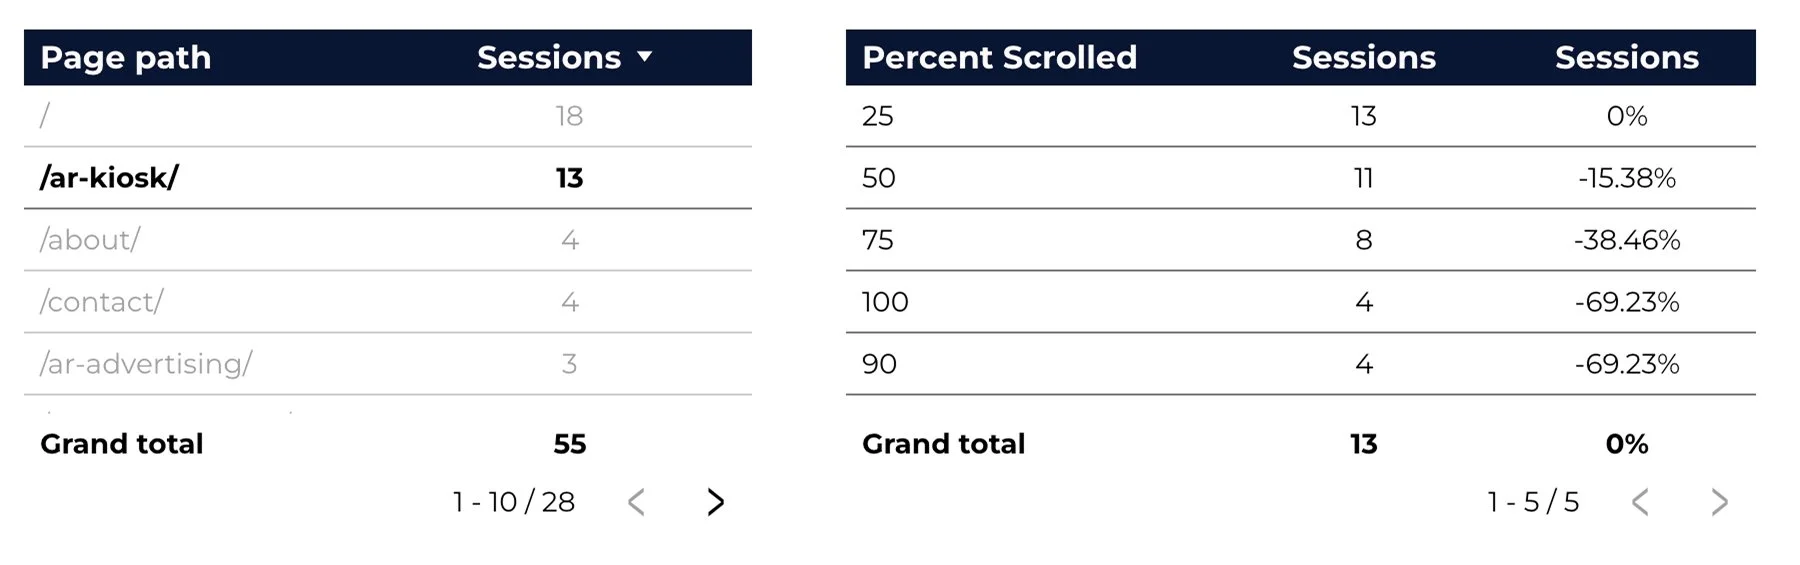
📊 On the /ar-kiosk/ page:
13 sessions started scrolling
11 made it to 50%
8 reached 75%, but only 4 got to 100%
👍 That’s better than average—just a 15% drop-off from 25% to 50%, and a solid chunk made it far down the page.
💡 What it tells you: This page might be more compelling or better structured. You could use this format as a reference for reworking other underperforming pages.
What to look for going forward
Sharp drop-offs between scroll points = missed opportunities
Pages with consistent scroll-through = strong layout or content strategy
High traffic but low scroll = maybe your above-the-fold content is enough (or maybe it’s not hooking anyone to keep going)
Track these patterns over time and across campaigns. Use them to shift CTA placement, rework content hierarchy, or prioritize testing.
Need more help?
Tracking scroll depth gives you real insight into how your content is performing—not just who lands on your page, but who engages with it. Set this up once, and it’ll quietly collect meaningful insights behind the scenes every day.
Still stuck or want help ? We offer done-for-you services, coaching, and soon enough - courses!
💙 Happy tracking & reporting!