
Marketing attribution guide
(How to tie traffic, leads, and sales back to their source)
Before we get into it, a small confession.
If you work in marketing and someone casually drops the word attribution into a meeting, there is a very specific feeling that can happen.
For me, it used to be a mix of:
skin tingling
heart rate up
brain going, I should know this
Because I’m a marketer. This is my career.
I’m supposed to have this locked down.
And yet.
Here’s the part no one really says out loud: most marketers were never formally trained in analytics.
Not in school.
Not in content marketing courses.
Not in “how to grow on social” programs.
A huge amount of marketing education is tactics-first.
Content. Platforms. Posting. Ads.
Very little of it teaches you how to connect effort to outcomes in a clean, confident way.
So if attribution has ever felt intimidating or like something you quietly hoped no one would quiz you on, you’re not behind.
This article is here to give you language, structure, and mental models so attribution stops feeling like a scary buzzword and starts feeling like something you actually understand.
Because none of us are trying to stay average going into 2026.
1. What attribution actually means
Say you’ve created a resource to grow your email list, generate leads, or drive sales… and you get that notification:
“You’ve gained a new subscriber.”

Woohoo 🎉
Pat on the back.
Then comes the important question: Where did they come from?
Was it:
a newsletter link
an Instagram post
a Pinterest pin
a Google ad
a LinkedIn post
your bio link
Whether you’re focused on newsletters, paid ads, SEO, or social (organic or paid), the problem is the same: If you can’t connect outcomes to their source, optimization becomes guesswork.
Attribution is what allows you to move from: “It feels like paid search is helping” to: “Paid search influenced 10% of our form submissions last month.”
That shift matters.
Because now you have:
a baseline
something to compare against
a benchmark you can intentionally grow
1.1 Attribution, simply put
How marketing efforts connect to outcomes
When we talk about attribution, we’re talking about how marketing efforts connect to outcomes over time.
Here’s a really decent definition found online: “An attribution strategy is a data-driven approach to assigning credit to different marketing touchpoints (ads, emails, social media, etc.) that influence a customer's journey, helping businesses understand which efforts drive conversions, optimize spending, and improve overall marketing ROI by revealing what's working best. It involves choosing an attribution model (like Last Click, First Click, or Data-Driven) to allocate value across the customer's path, from initial awareness to final purchase, ensuring all channels get appropriate recognition.”
It’s about tracing the touchpoints someone has with your brand across channels like:
paid ads
website visits
email campaigns
social content
even offline sources like calls or direct emails
Attribution uses analytics tools and models to analyze this journey and assign credit to different interactions so you can understand:
which channels influence decisions
how people move through the funnel
what role each interaction plays before conversion
The goal is informed decision-making for your marketing strategy.
1.2 How marketers actually use the word “attribution”
If you’ve ever wondered, “okay but how do I even use this word without sounding like a fool?”, I gotchuuu, here’s what it looks like in real life.
Examples using the word in sentences
When talking about performance
Our attribution data shows paid search influenced 10% of form submissions
Without proper attribution, we’re optimizing based on assumptions
Attribution helps us tie traffic, leads, and sales back to their source
In planning and decision-making
We’re investing more here because attribution shows it consistently supports conversions
This strategy prioritizes improving attribution before increasing spend
When explaining limitations
Attribution isn’t perfect: it’s directional, not absolute
No model tells the full story; it explains patterns, not certainty
Attribution language (without using the word)
Here’s the thing: a lot of attribution conversations don’t actually use the word attribution at all. They show up as observations, explanations, and decisions that are clearly informed by it.
For example:
When reviewing results
Paid search closed most conversions, but email showed up earlier in the journey for a majority of converters.
Social doesn’t appear as last-touch very often, but people who convert tend to interact with it multiple times.
Organic traffic drove fewer conversions, but it’s responsible for most first-time visits.
When comparing channels
PPC brings in higher-intent traffic, while SEO supports discovery and long-term demand
This channel doesn’t convert on its own, but performance drops when we pull back on it.
These two channels work better together than they do separately.
When defending strategy
If we only looked at last-click, we’d cut this channel, but that would ignore how it supports the funnel.
This campaign didn’t spike conversions immediately, but it improved downstream performance over time.
Cutting this would save budget short term, but likely hurt conversion rates later.
This is attribution in practice.
It’s not about name-dropping “attribution” in every meeting, that can get… a little pretentious.
It’s about understanding how effort connects to outcomes and explaining that connection clearly, even when the data isn’t perfect.
2. How attribution is identified: default vs customized dimensions
Before attribution becomes reports or dashboards, it starts with structure.
That structure comes from something called dimensions.
2.1 What are dimensions, really?
In analytics, a dimension is simply a way to label or describe traffic and actions so you can analyze them later.
If metrics answer how much (sessions, conversions, revenue), dimensions answer where it came from and how it happened.
For example, dimensions can describe things like:
where someone is located (country, city)
who they are (device type, gender, age range)
how they arrived (source, medium, campaign)
when it happened (date, day of week, time of day)
Every time you filter a report by country, compare performance by city, or review results by source or campaign, you’re working with dimensions. You just may not have called them that.
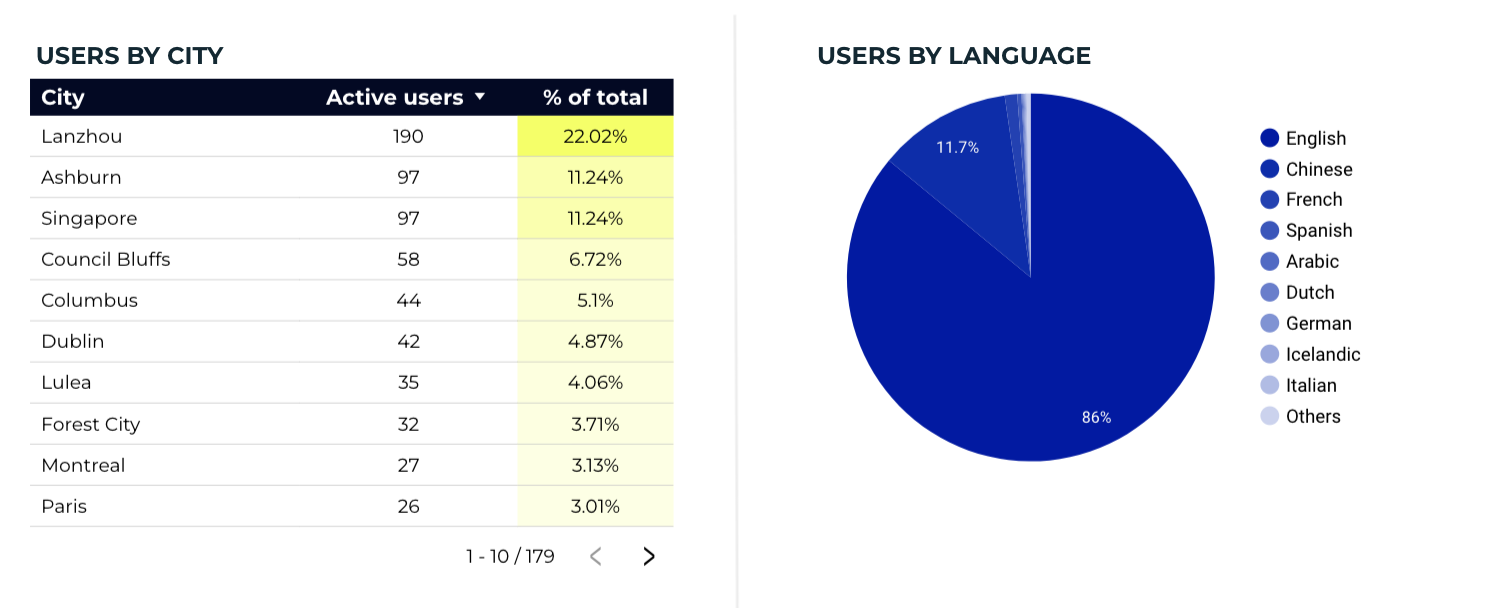
So in these examples, the dimensions would be the city or the language. And the metric is the users count.
2.2 Those “weird codes” you see in URLs? Those are dimensions.
You’ve probably clicked on a link that looks like this:
exampleurl.com/about?utm_source=newsletter&utm_medium=email&utm_campaign=newsletter_february_2025
It looks technical, but each part is simply a label:
where the click came from
how it happened
what initiative it belonged to
Those labels travel with the click and later appear in analytics reports.
This is how attribution gets structured.
2.3 Default vs intentional attribution fields
Some attribution fields exist automatically in analytics tools. Others only exist if you define them intentionally.
Common default fields
Channel
Source
Medium
These often populate even without the use of a UTM code, though not always cleanly.
Intentional fields
Campaign
Content
Term
These only exist if you define them. If they’re missing, reports show gaps like “(not set).”
If you want a simple way to keep these fields clean and consistent over time, we’ve shared the UTM tracker we use to structure attribution properly: the download comes with a template sheet + document that explains how to think about structuring your codes in detail.
3. Attribution system: collection ≠ reporting ≠ optimization
Remember how we talked about using attribution in a sentence?
Here’s a good example:
“Our attribution shows that email and paid search consistently support conversions, even when they’re not the final touchpoint.”
Notice what’s happening there.
Attribution isn’t being described as:
a button you clicked
a single report
one magic metric
It’s being described as the outcome of a system.
That system has three layers: collection, reporting, and optimization.
3.1 Collection
What gets tracked, and how clean the inputs are.
Attribution starts long before reporting and sets the stage for better reporting.
Collection includes:
how links are tagged and named (UTMs)
which actions you decide are worth tracking
how those actions are defined as events or conversions
how your tools talk to each other
and whether any of this stays consistent over time
Issues here could look like:
multiple actions tracked as the same event
important steps in the funnel not tracked at all
links tagged differently depending on who published them
conversions defined differently across platforms
You’re left asking:
Does this number actually represent what we think it does?
Can we compare this month to last month?
And no dashboard or report can fix that.
3.2 Reporting
Reporting isn’t just about pulling numbers into charts.
It’s about deciding what questions the report is meant to answer and designing everything around that with a set of best practices.
It helps to ground this in a real scenario.
A real example: reporting to a busy CEO
Let’s say you’re reporting to a CEO who wants to know one thing:
Should we keep investing in SEO and PPC?
They’re not looking to audit your keyword lists.
They don’t want to debate click-through rates.
And they will lose interest very quickly if the report is filled with platform-specific metrics that don’t connect to outcomes.
What they do care about is:
how SEO and PPC are contributing to end conversions
and whether performance is improving compared to before you got involved
So instead of leading with keywords, impressions, and CTRs, (which are useful for you as the practitioner), the report should surface something like:
SEO contributed X% of total form submissions
PPC contributed Y% of total form submissions
Together, these channels now drive more qualified conversions than they did before and by how much
That framing answers the actual decision in front of them and makes you far more valuable because it respects their time. It allows them to understand the takeaway without needing a marketing education or wading through jargon, which matters when their attention is already stretched thin.
Tactics and design
Good reports are also built using specific choices and techniques, such as:
establishing a clear baseline period
separating general, demographic, and retargeting efforts
comparing campaign-driven traffic to all other sources
anchoring results to end conversions rather than platform metrics
Those details matter but they’re not just technical decisions. They’re communication decisions.
What you choose to show, what you lead with, and how you frame results directly influence how the data is interpreted and what action gets taken next. This is the same principle we break down in our article on pricing psychology: how framing, context, and contrast shape perception, even when the underlying numbers don’t change.
If you’re curious how those psychological principles apply to analytics and reporting, we explore that connection in more depth here:
👉 What pricing psychology can teach us about marketing analytics reporting
3.3 Optimization
Where data actually changes decisions
Optimization sounds tactical. In reality, it’s often about buy-in.
Most meaningful changes don’t happen because someone found a better CTR. They happen because data helped:
justify a risky idea
unlock budget
move a skeptical stakeholder
or support a shift that needed approval
That’s where attribution and reporting matter most. Not to tweak settings, but to change minds.
A real example: using data to unlock a creative shift
One client we worked with was very resistant to using memes and lo-fi video content.
They had strict brand rules, limited footage, and tight restrictions around filming on site. From their perspective, this type of content felt risky.
So instead of debating taste, we tested it and measured the full journey, not just surface metrics.
We didn’t report on clicks or CTR alone.
We looked at:
Engagement
site behavior
sign-ups for their app
and how this content performed compared to existing formats
The results were clear.
Even with constraints, the meme-style content:
drove stronger engagement
supported more sign-ups
and performed better across the conversion path
That changed the conversation.
Not “do we like this?”
But “the data shows this works. How do we scale it responsibly?”
That’s optimization.
Why this is how optimization usually works
Most optimization decisions aren’t blocked by ideas. They’re blocked by:
approval layers
budget ownership
brand risk tolerance
and internal skepticism
Data gives you leverage in those moments.
Not because it’s perfect.
But because it provides directional proof that a change is worth making.
This is why optimization often looks less like changing buttons and more like:
reframing priorities
building confidence with stakeholders
and using data to move planning forward
The tactics matter. But the real work happens in the decisions that data makes possible.
Then you will achieve this look afterwards, which is a small but powerful change.
Your data should guide, not exhaust.
Quick pause before we get into limitations.
Collection, reporting, and optimization are the backbone of a solid attribution strategy. And honestly if I tried to include every tip, edge case, and “what not to do” here, this article would turn into a full-on course.
Which… is exactly why we’re building one.
If you want to go deeper, our upcoming courses will break this down step by step, with real examples and real-world messiness (because that’s how this actually shows up at work).
What we’ll cover inside:
how to structure and standardize UTMs (without overthinking them)
real-life attribution setups that are confusing and how to clean them up
how to think about tech stacks and tool choices
how to design reports based on who you’re presenting to and what decisions they need to make
how to include clear recommendations in reports, not just numbers
And much much more!
If that sounds useful, you can join the course waitlist here.
4. Models to assign attribution credit
An attribution model is just a way of deciding which part of the journey you’re looking at when you review performance.
Let’s walk through the most common ones.
First-touch attribution
Where did this relationship start?
First-touch attribution focuses on the first interaction someone had with your brand.
In reporting, this usually shows up through dimensions like:
first user channel
first user source
This view is useful for understanding:
how people discover you
which channels introduce new audiences
what drives awareness and initial interest
First-touch doesn’t tell you what made someone convert. It tells you how the relationship began.
Last-touch attribution
What pushed someone to act?
Last-touch attribution focuses on the final interaction before a conversion.
This is often reflected in:
session-based channel or source dimensions
conversion reports tied to the most recent visit
Most tools default to this view because it’s straightforward. If someone clicked a Facebook ad and filled out a form, that conversion is attributed to Facebook.
Last-touch is helpful for understanding:
which channels close the loop
what people interact with right before taking action
But it doesn’t mean earlier steps didn’t matter. They’re just not what’s being highlighted.
Multi-journey attribution
How do channels work together over time?
Multi-journey attribution doesn’t live in a single dropdown. Instead of assigning all credit to one moment, it looks at patterns across multiple interactions.
In practice, this is done by:
comparing first-touch and last-touch views
reviewing which channels show up repeatedly before conversions
analyzing sessions or engagement for users who eventually convert
looking at trends over time instead of single interactions
Rather than asking: “Which channel gets the credit?”
Multi-journey analysis asks: “Which channels consistently support the journey?”
This is how you uncover insights like:
channels that introduce but rarely close
channels that assist conversions without being the final step
combinations of channels that tend to perform well together
Multi-journey attribution is less about precision and more about pattern recognition.
The part that actually matters
You won’t be able to report on every attribution model perfectly. What matters is being aware of those gaps when interpreting results.
Because sooner or later, someone will look at a report and say:
“Social isn’t doing anything.”
“Why invest in the website if PPC is driving conversions?”
Attribution gives you the language to explain what the report isn’t showing.
Some channels introduce people.
Some build trust.
Some quietly support the journey.
And some happen to be the final click.
Those “silent” channels may not close the loop, but they’re often the reason it closes at all.
Attribution isn’t about proving one channel is the winner. It’s about understanding how everything works together and avoiding decisions that cut the backbone of your performance.
5. Privacy limitations (gaps in data)
What shows up in reports today is shaped by:
consent choices
cookie restrictions
device switching
privacy-first defaults at the browser and platform level
As a result, some data will always be missing. That doesn’t mean your setup failed. It means you’re working within real-world constraints.
I’ve been in digital marketing for over a decade, and the shift is very real, analytics used to surface far more demographic and behavioral data by default than it does today. Now, some of that data requires additional signals to be enabled, and even then, it’s often incomplete.
So when something doesn’t show up in a report, it’s not always because something is “broken.” It can simply be that the data is no longer available in the same way it once was or you would think it should.
What this actually looks like in practice
Over time, changes in how data is collected mean that:
some users can’t be tracked across sessions
some interactions are intentionally hidden
some conversions lose earlier touchpoints
On top of that, many analytics tools, including Google Analytics, rely on thresholds and sampling to protect user privacy.
In simple terms, this means:
certain data won’t appear unless enough users meet the criteria
some dimensions only populate once a minimum volume is reached
smaller segments are often hidden or sampled to avoid exposing identifiable behavior
This is why you might see:
demographics missing or partially populated
channel breakdowns that look “thinner” than expected
numbers that change slightly depending on the report or date range
Your reports don’t reflect everything that happened. They reflect what can reasonably be observed once privacy rules, thresholds, and sampling are applied.
A real-world example: when tools don’t agree
On one website, we saw Google Ads reporting nearly double the number of conversions compared to Google Analytics.
After exploring further, the issue wasn’t the ads, it was consent. A large portion of users weren’t accepting the cookie banner, which meant Google Analytics couldn’t reliably track their actions once they landed on the site. Google Ads, however, was still able to attribute conversions using its own measurement logic.
This kind of discrepancy is increasingly common.
It doesn’t mean one tool is “right” and the other is “wrong.” It means they’re operating under different privacy and measurement constraints.
In cases where this gap becomes too large to ignore, some teams explore server-side tracking, which collects events earlier in the process and relies less on browser-based cookies. This can reduce data loss, but it also adds complexity.
Improving reliability (without chasing perfection)
There are ways to improve attribution quality over time, but they exist on a spectrum.
Some lighter improvements include:
enabling available signals and consent-based tracking in GA
understanding when and how sampling affects reports
keeping UTMs clean and consistent
More advanced approaches can include:
server-side tracking to reduce browser-related data loss
These methods can improve reliability, but they’re optimizations, not prerequisites.
Attribution isn’t about eliminating uncertainty. It’s about knowing where the uncertainty lives and making smarter decisions anyway.
6. Offline influence (and where attribution gets stitched together)
Not everything happens online.
People still:
hear about businesses through word of mouth
get referred by friends or colleagues
call a phone number directly
walk into a physical location
make decisions after offline conversations
In many of these cases, there is no clickable link to track.
From an analytics perspective, this often shows up as:
“Direct” traffic
unattributed conversions
conversions that appear disconnected from earlier marketing efforts
How offline data shows up inside marketing platforms
While you can’t track every offline interaction, many advertising platforms allow you to bring offline data back into the system in useful ways.
For example:
uploading customer or lead lists into Google Ads
creating audiences in paid social platforms using email lists
excluding existing customers from campaigns
targeting past clients differently than new prospects
This kind of setup blends online and offline attribution.
You’re no longer just reacting to:
“they visited this page”
“they clicked this ad”
You’re making decisions based on:
who is already a customer
who has converted offline
who should not be seeing certain ads anymore
That context is incredibly powerful for optimization.
The reality: it works best at scale, and it’s not perfect
Offline matching relies on platforms being able to recognize users based on things like email addresses or phone numbers.
That comes with limitations:
platforms require minimum list sizes before audiences can be used
not every email or contact will match to a platform user
match rates vary depending on data quality and platform coverage
So while these tools are extremely useful, they’re not always a possibility.
You might upload a customer list of 10,000 people and only see a portion of that list become usable for targeting or exclusions. That’s normal.
Why this still matters for attribution and optimization
Even with imperfect match rates, offline data helps answer questions that pure website analytics cannot.
It allows you to:
stop advertising to people who are already clients
separate acquisition from retention efforts
better understand which campaigns support real business outcomes
avoid over-attributing performance to last-click online behavior
This is especially important when:
sales happen offline
conversions involve phone calls or in-person steps
long consideration cycles are common
Offline influence doesn’t break attribution. It adds context to it.
You may not be able to track every step, but acknowledging and accounting for offline activity leads to smarter decisions than pretending everything happens in a browser.
Final thoughts
Waiting for perfect data is one of the fastest ways to stall your marketing.
If you wanted to optimize your health, you wouldn’t rely on a single metric. You might look at weight, body composition, blood pressure, sleep, or bloodwork. None of those measurements alone tells the full story, but together, they give you benchmarks you can work with.
Marketing attribution works the same way.
Strong marketers don’t look for perfect data. They look for signals, review them over time, and make decisions with context instead of gut instinct.
Attribution won’t tell you everything. But it will tell you enough to move forward with confidence, which is way more professional than your intuition.
Your attribution data won’t capture every influence, but it will reveal patterns that are stable enough to act on. And that’s what makes it valuable.
💙 The Harsh Marketing Team