
How to track your website video views and report the data
Embedding a YouTube video on your site is one thing. But knowing if anyone actually watches it?
That’s the real tea. 🍵
Whether you’re trying to prove ROI on a video or just curious if people are making it past the 10% mark, this guide shows you how to:
Track video views and engagement with Google Tag Manager (GTM)
Send that data to Google Analytics 4 (GA4)
Build a clean, visual report in Looker Studio
📸 Here’s what your final setup could look like:
By the end of this, you'll have your own live report showing which videos people are watching – and where they drop off. You can click the video titles in the left table to filter the % watched in the second table to the right. Now you can see the exact drop off rates and say things like:
“For video #2 (name X), 33% of people are dropping off at the 50% mark.” Giving you a clearer idea of your video’s ability to capture attention and keep it.
✅ What You Need First
Before you dive into the set up, you’ll need:
A GA4 account set up - here’s an article on how to set it up
A GTM container installed on your website - here’s an article on how to set it up
Step 1: Turn on the right built-in variables in GTM
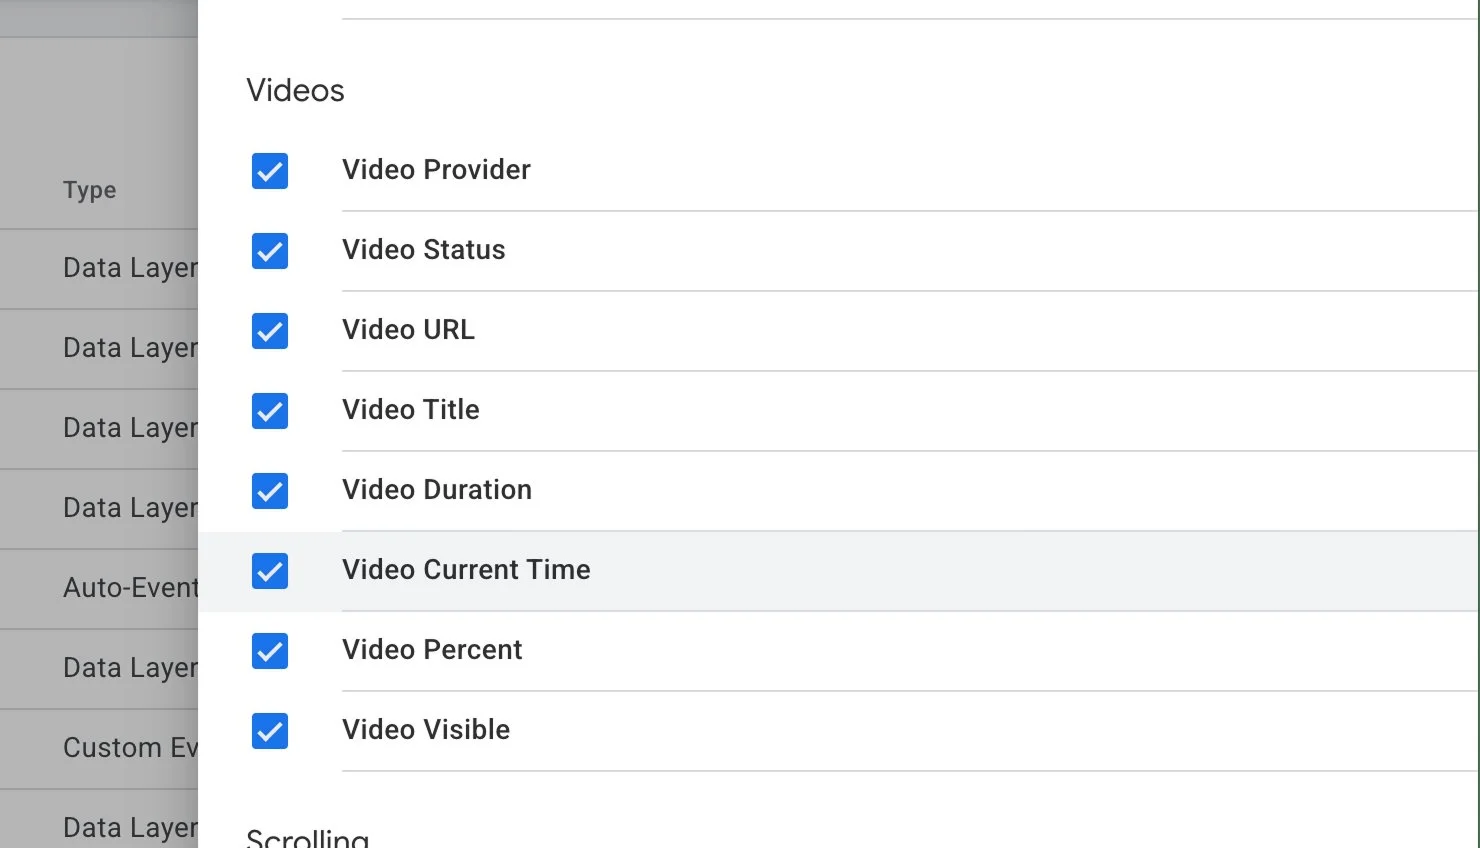
Go to Variables in your GTM workspace, scroll to the bottom, and click Configure. Under the Videos section, enable all relevant options:
Video Provider
Video Status
Video URL
Video Title
Video Duration
Video Current Time
Video Percent ← the MVP for tracking viewer progress
Video Visible
✅ These are what let GTM pull in dynamic data from your embedded videos.
Step 2: Create your video tracking tag
Next, head to Tags > New, and set up a GA4 Event tag.
Here’s what to include:
Measurement ID: Your GA4 property ID - article on where to find your GA4 ID
Event Name: video_tracking (it can be anything really, but this is a clean option)
Event Parameters:
video_title → {{Video Title}}
video_url → {{Video URL}}
video_percent → {{Video Percent}}

Step 3: Set up the trigger
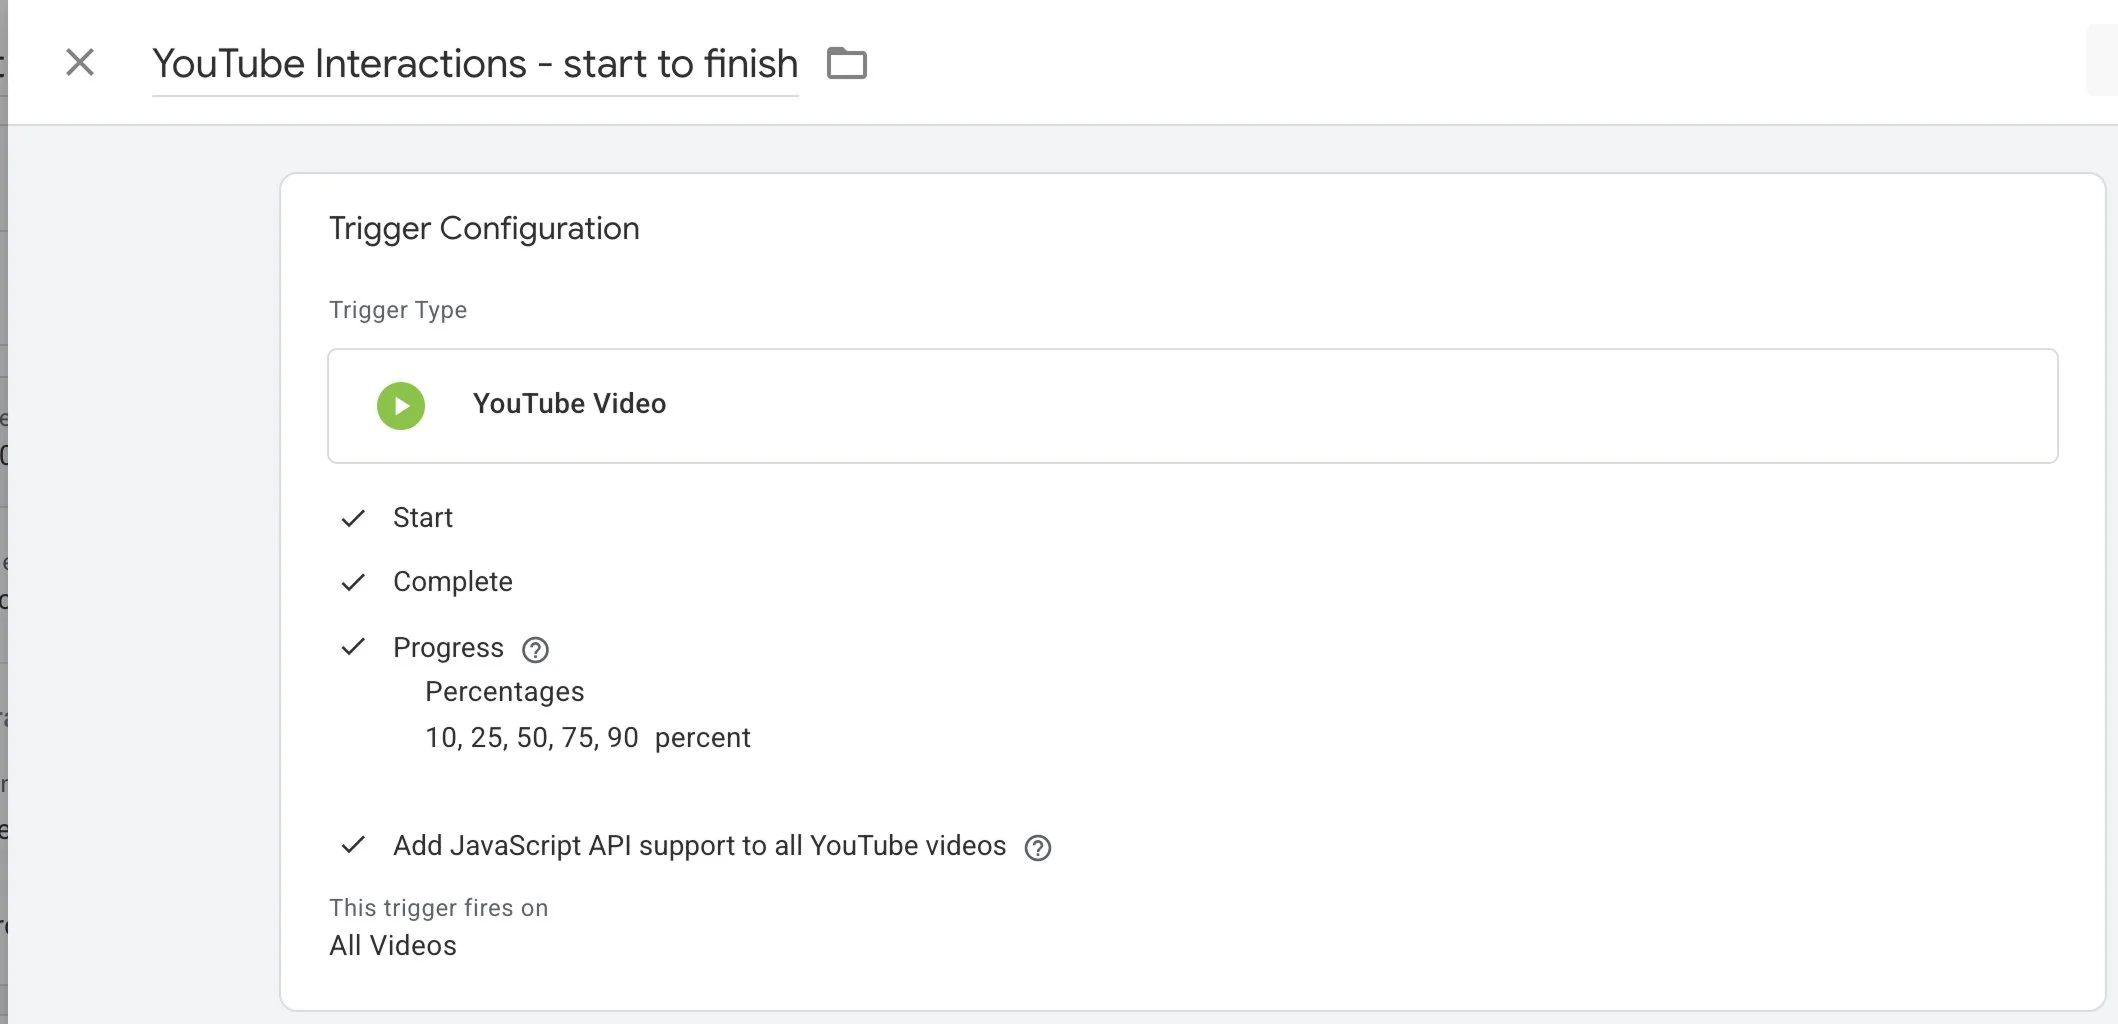
Create a new Trigger using the YouTube Video trigger type.
Here’s how to configure it:
✅ Start
✅ Complete
✅ Progress → Add checkpoints like 10, 25, 50, 75, 90 (or whatever you want)
✅ Check the box to add JavaScript API support
📌 This trigger will fire your tag at key video milestones, giving you insights from first play to the final second.
Step 4: test & publish
Before hitting publish, make sure your tag and trigger are firing correctly.
Here’s how:
1. In GTM, click Preview in the top right corner.

2. Enter your site URL and click Connect. This opens your site in debug mode. It will open up another window with your site’s front-end view as well. Keep both open.
3. Play the embedded YouTube video on your site.
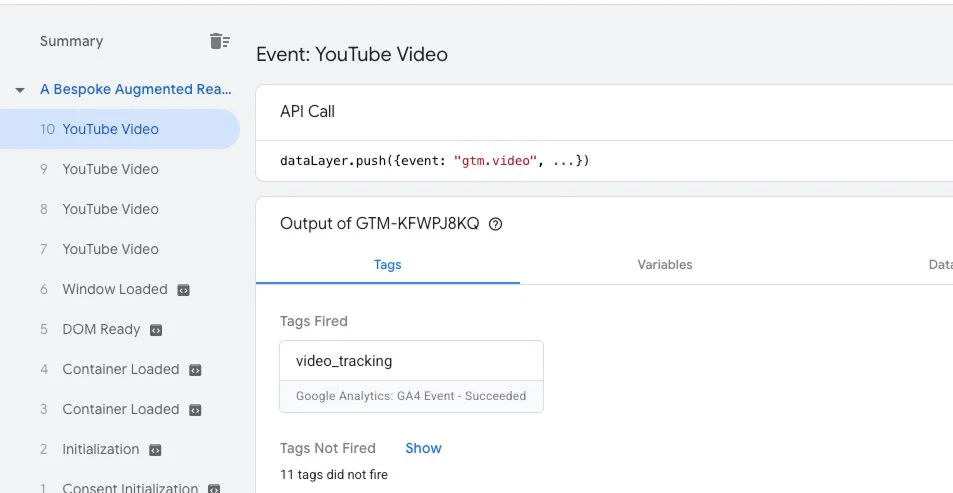
4. In the debug panel, look under Tags Fired “summary pannel” and confirm your GA4 event is showing up when the video starts, hits milestones, or completes.
Play the video throughout or click throughout to see if the specific tracking parameters show up too.
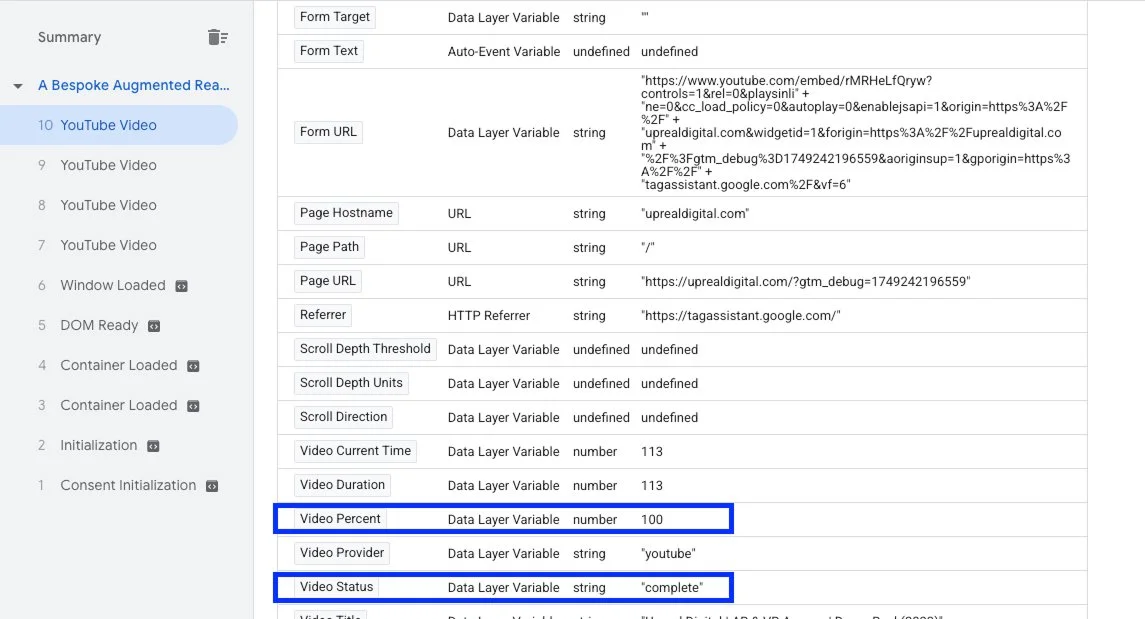
For example, this event fired for the completion:
I can see under the variables tab that the video_percent parameter flagged it as 100
Once it’s working:
✅ Hit Submit in GTM to publish your changes.
You’re now collecting video view data in GA4.
Step 5: Register custom dimensions in GA4
This step trips a lot of people up. GA4 calls them Custom Definitions, GTM calls them parameters, and in Looker Studio, they’re just dimensions. Confusing? Absolutely. But it’s still worth doing.
In GA4:
Go to Admin > Custom Definitions
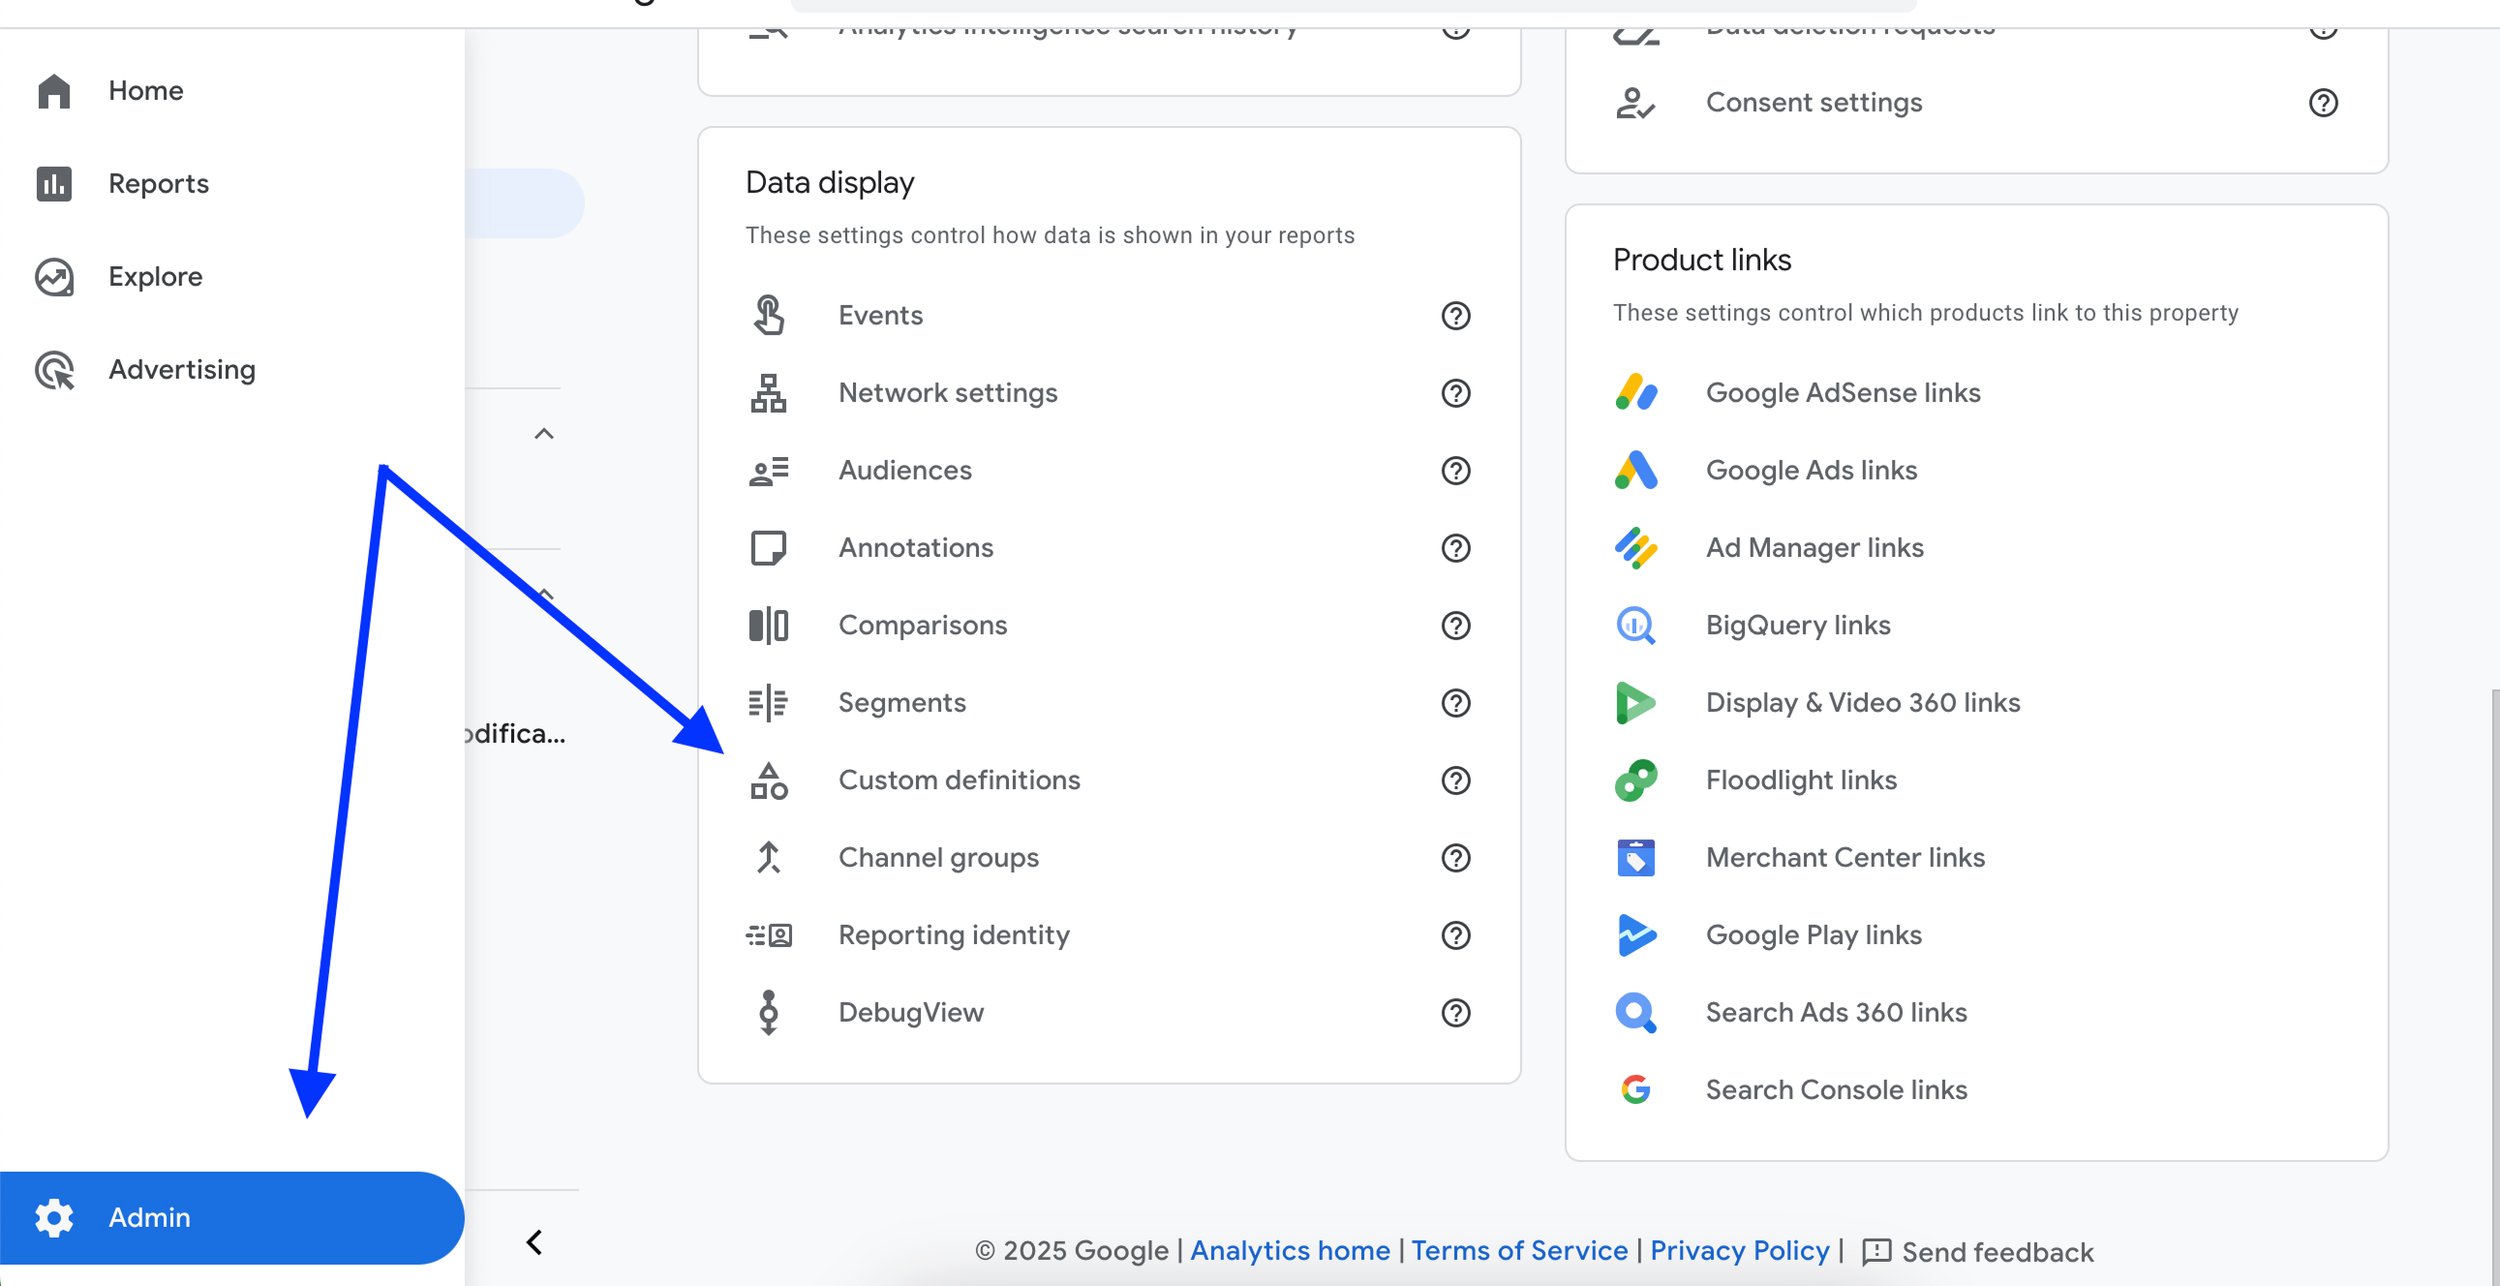
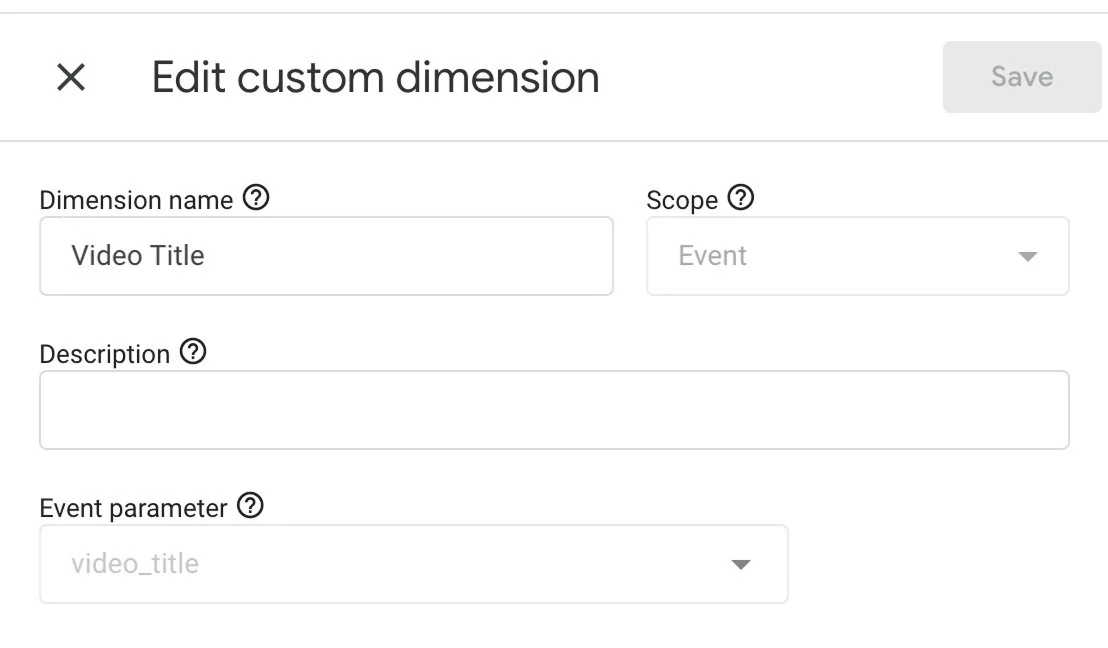
Click Create Custom Dimension

Name: Video Title
Scope: Event
Parameter Name: video_title
Repeat for:
video_url
video_percent
🧠 These definitions are what allow Looker Studio to see and filter by your video details later.

💡 If your tag’s already been firing without these set up, GA4 won’t backfill that data into your reports. Even if the parameter was collected, it won’t show up until you register it as a custom dimension. So yeah... don’t skip this step.
Step 6: build your report in Looker Studio
Note that you won’t see any data in these tables until videos have been watched and the tags are properly set up. To give yourself some data, go and watch the videos a few times.
In a report in Looker Studio, add three separate tables
Table 1: dimension = video_title, metric = sessions, filter = event (video tracking)
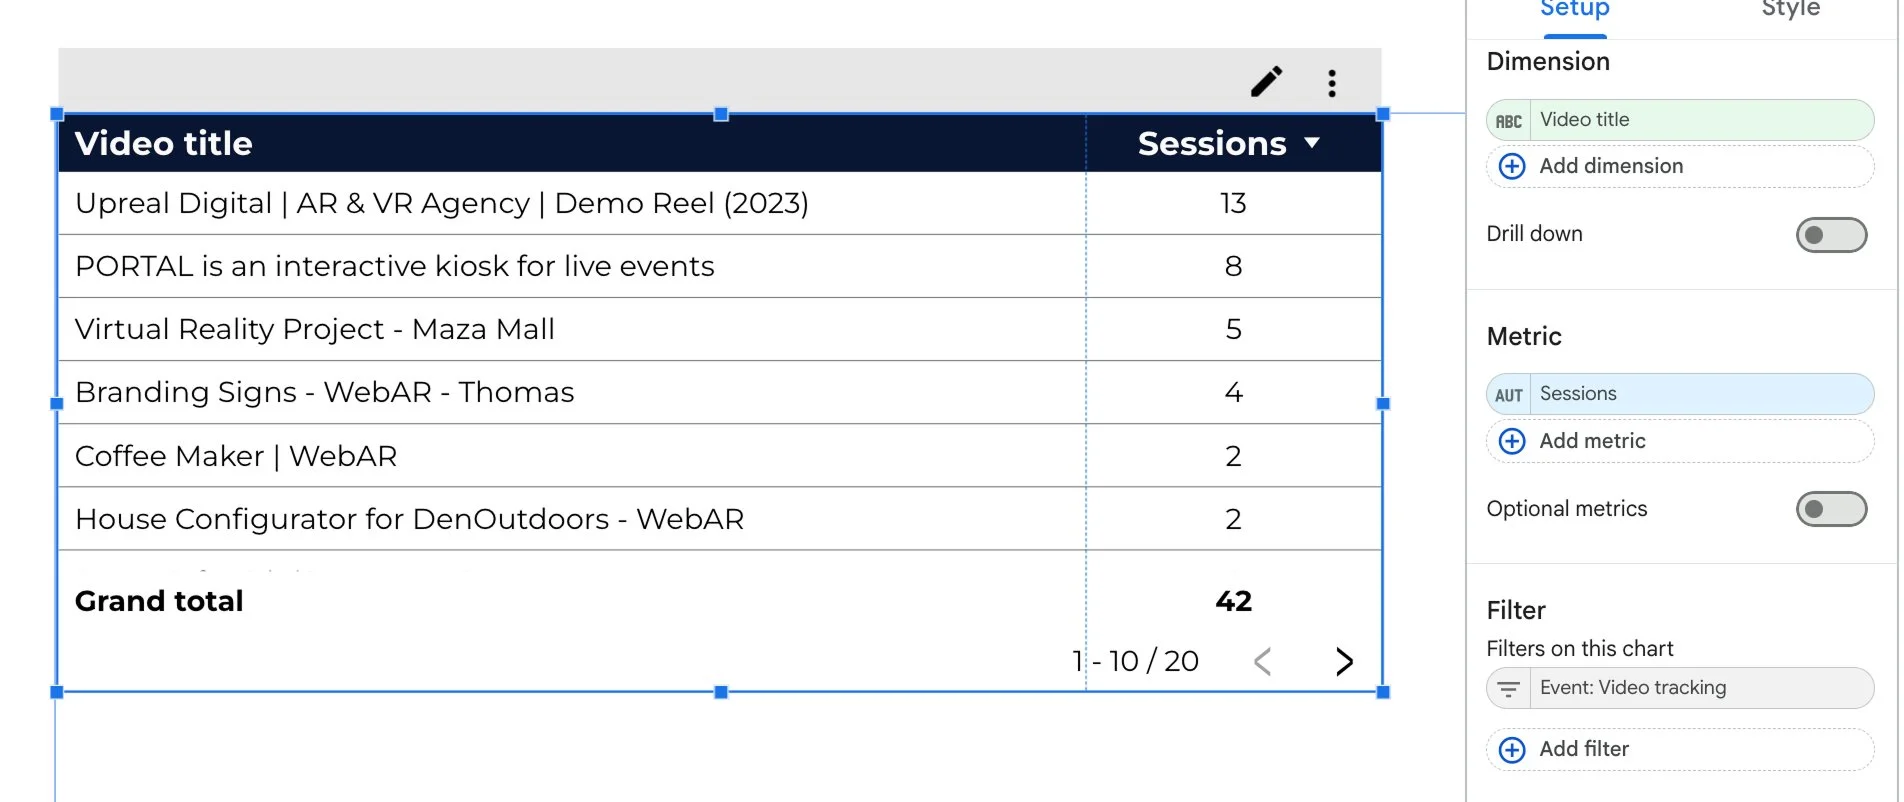
How our filter looks:

Table 2: dimension = video_percent, metric = sessions, and the same filter of video tracking
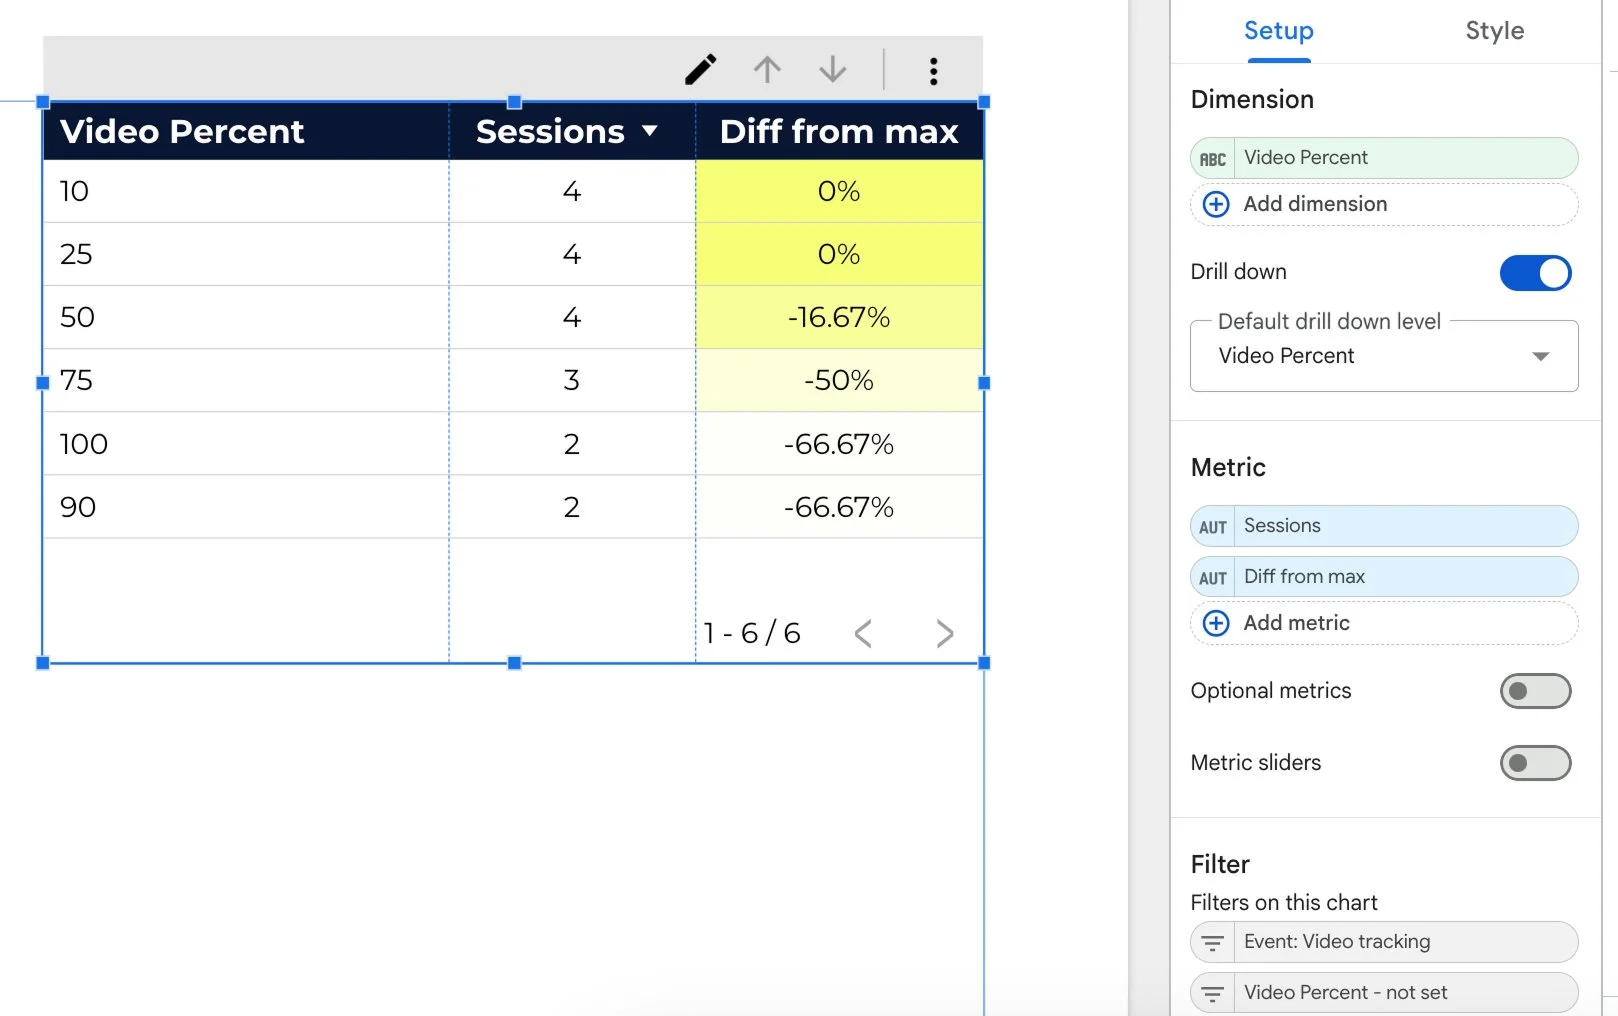
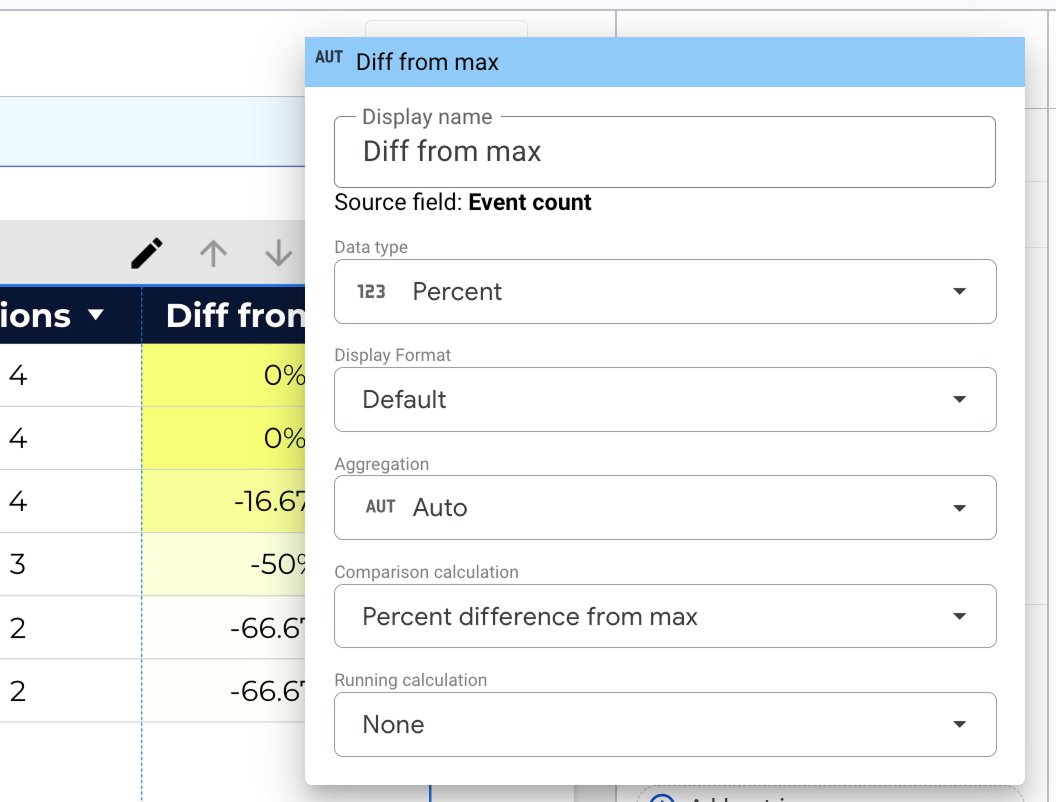
If you want another column that helps contextualize those numbers, add another sessions metric (yes the same as before, you can add it more than once), and customize it to show “difference from max”. Change the “display name” with your text, and change the “comparison calculation” to difference from max.
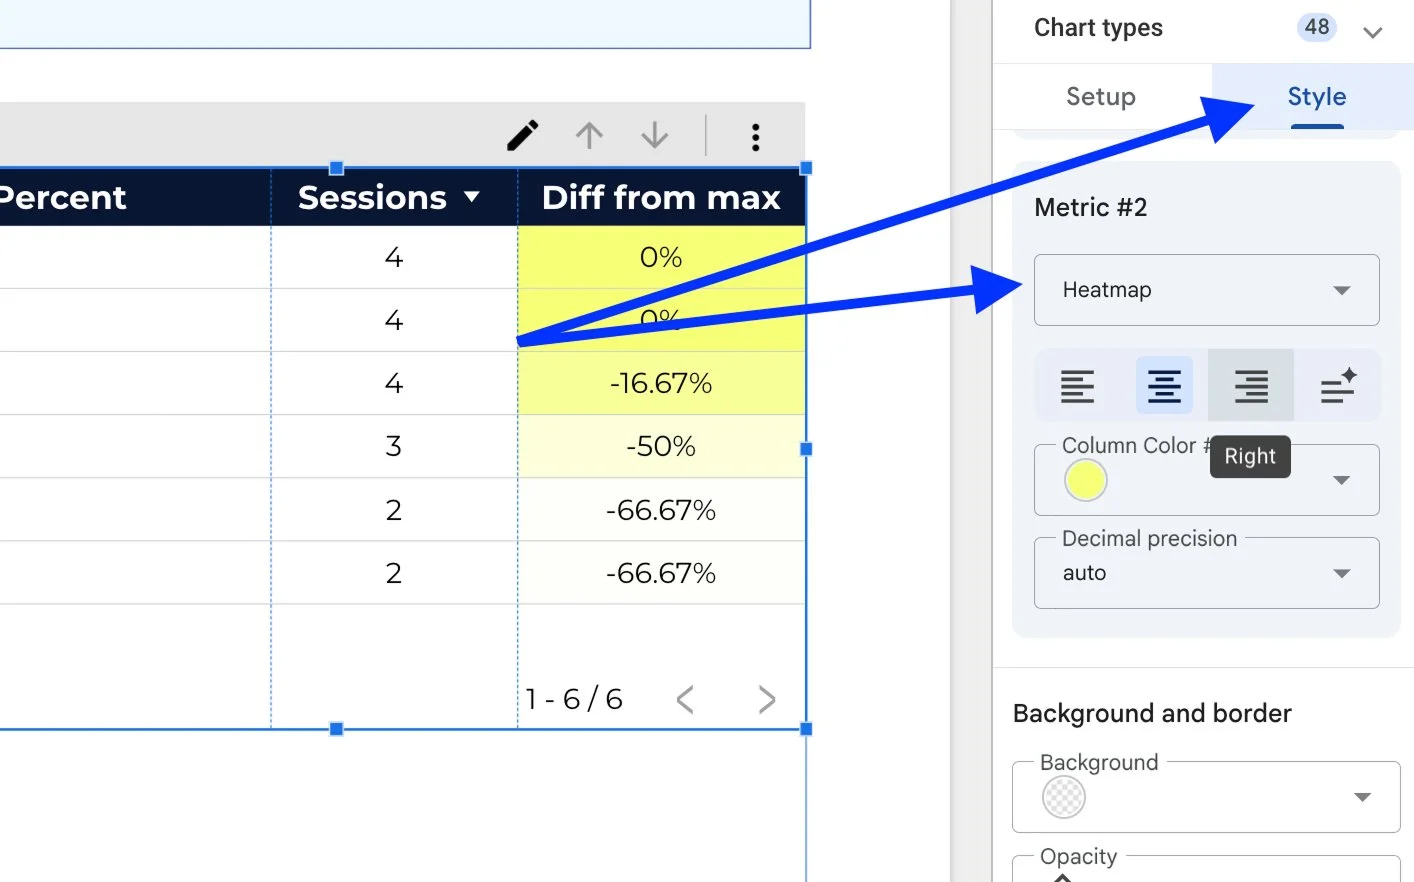
Then you can also add a heatmap colour gradient, which is just fun and visually appealing, by going to the “style tab” and choosing heatmap for your second metric and the colour of your choice.
(optional) Table 3: dimension = Landing Page, metric =sessions, and the same video filter

On each of those tables, enable cross filtering by going to set up, and clicking the cross-filtering toggle. You can do this simultaneously for all tables at once by selecting them all.

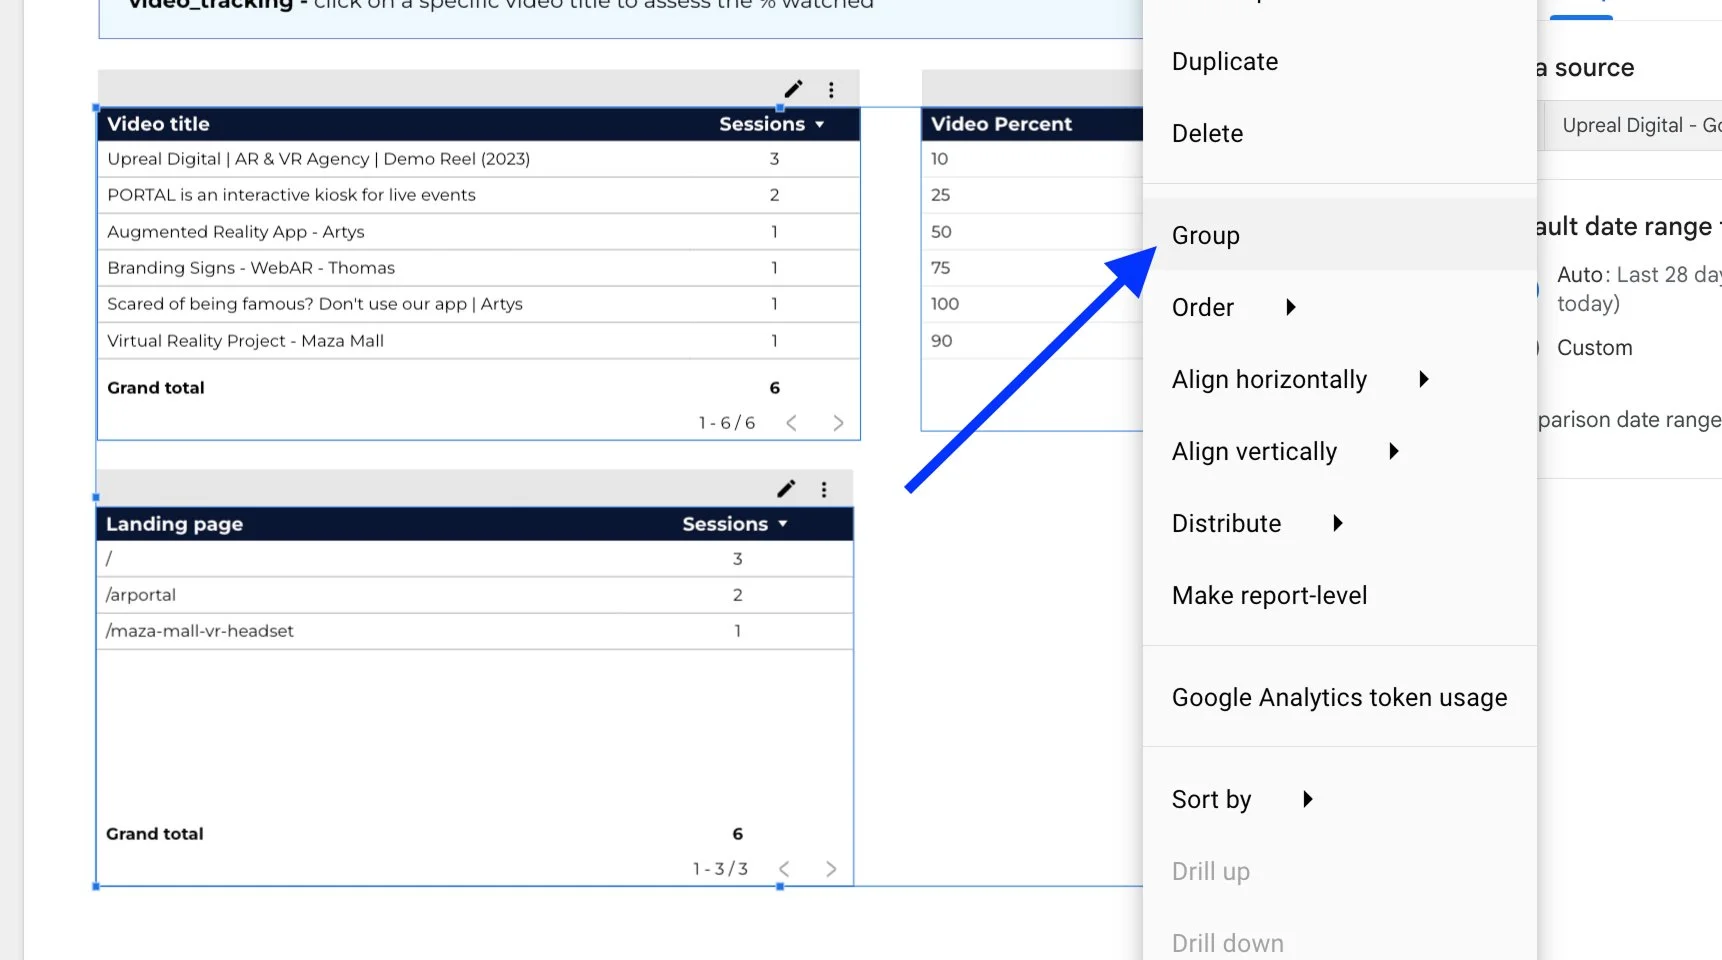
Now group those tables together by zooming out and selecting all three and right clicking, then click on “group” in the pop-up menu. This will ensure that the cross-filtering happens for those 3 tables and not other elements on your page. Unless you don’t care for that to happen, in which case you can keep it ungrouped.
Lastly, consider adding a date control to select the date range you want to filter by.
Your page should look something like this now. I’ve also added a text box to explain the event above the tables.

Now you can see:
Which videos are being watched
How far people get through them
Where engagement drops off
Step 7: Interpret the Data
Setting up tracking and reporting is great. But knowing how to read it? Even better.
Click on one of the videos listed in table A, which will then show you the breakdown of % watched + which landed pages it was watched from:
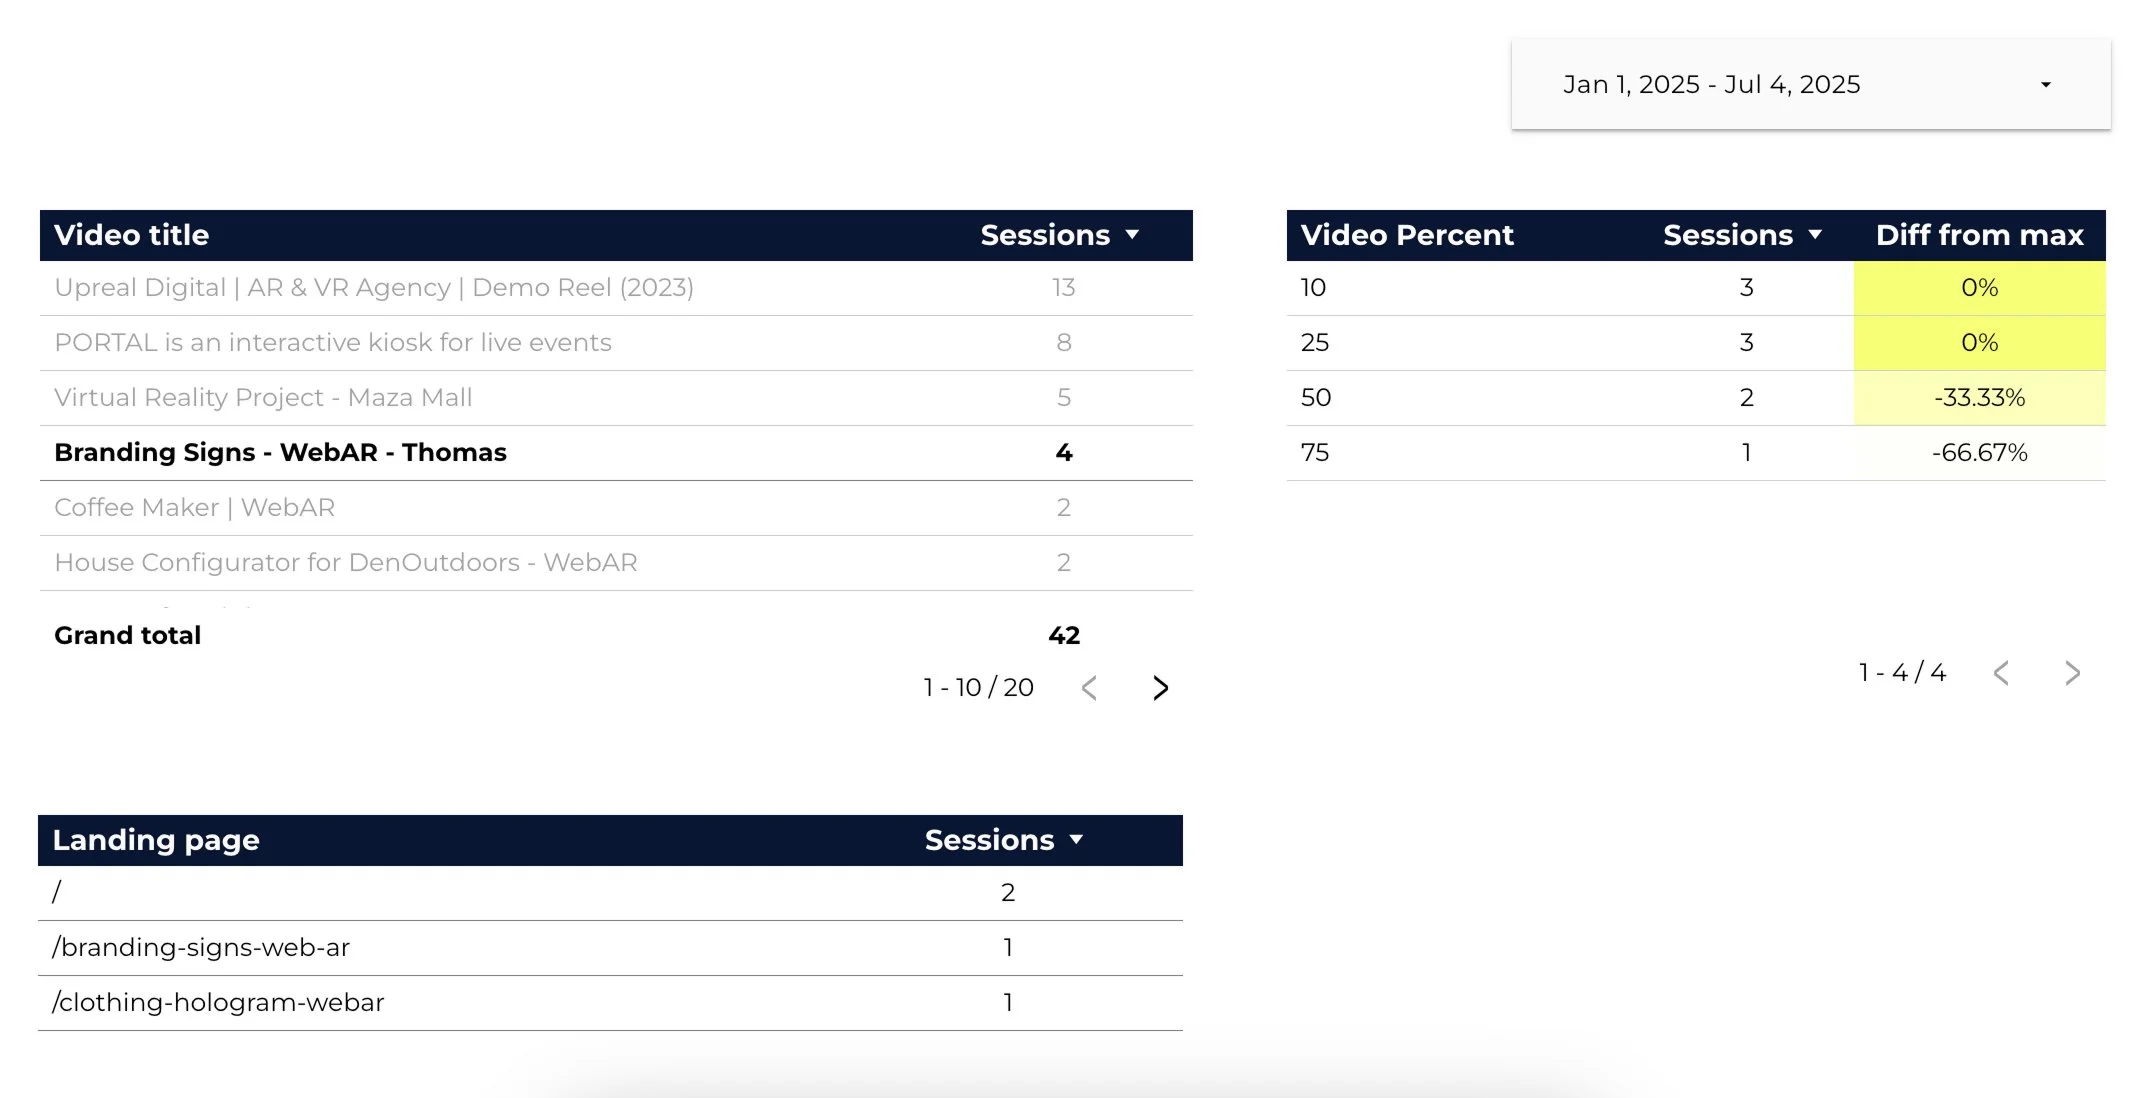
In this example we see that the “branding signs” video has a 33% drop off at the 50% mark, and a 66% drop off at the 75% mark. Of course the data is very minimal here but when there’s large sets of data, this gets really interesting.
Say your video has a 30-40% drop off rate within the first 10% mark of the video, this could warrant a switch and edit to your video’s introduction. Or if the most important part of the video is near the halway mark but most users don’t make it there, consider shortening or editing the video accordingly.
Why this matters
Video views are often a black box. With this setup, you get:
Measurable proof of engagement
Content insights to guide future creative
A client-friendly way to showcase impact
Need help setting this up or want a custom Looker Studio dashboard built for your brand? Reach out to us for 1-1 coaching or for done-for-you services – we love a good data glow-up. ⚡
💙 The Harsh Marketing Team